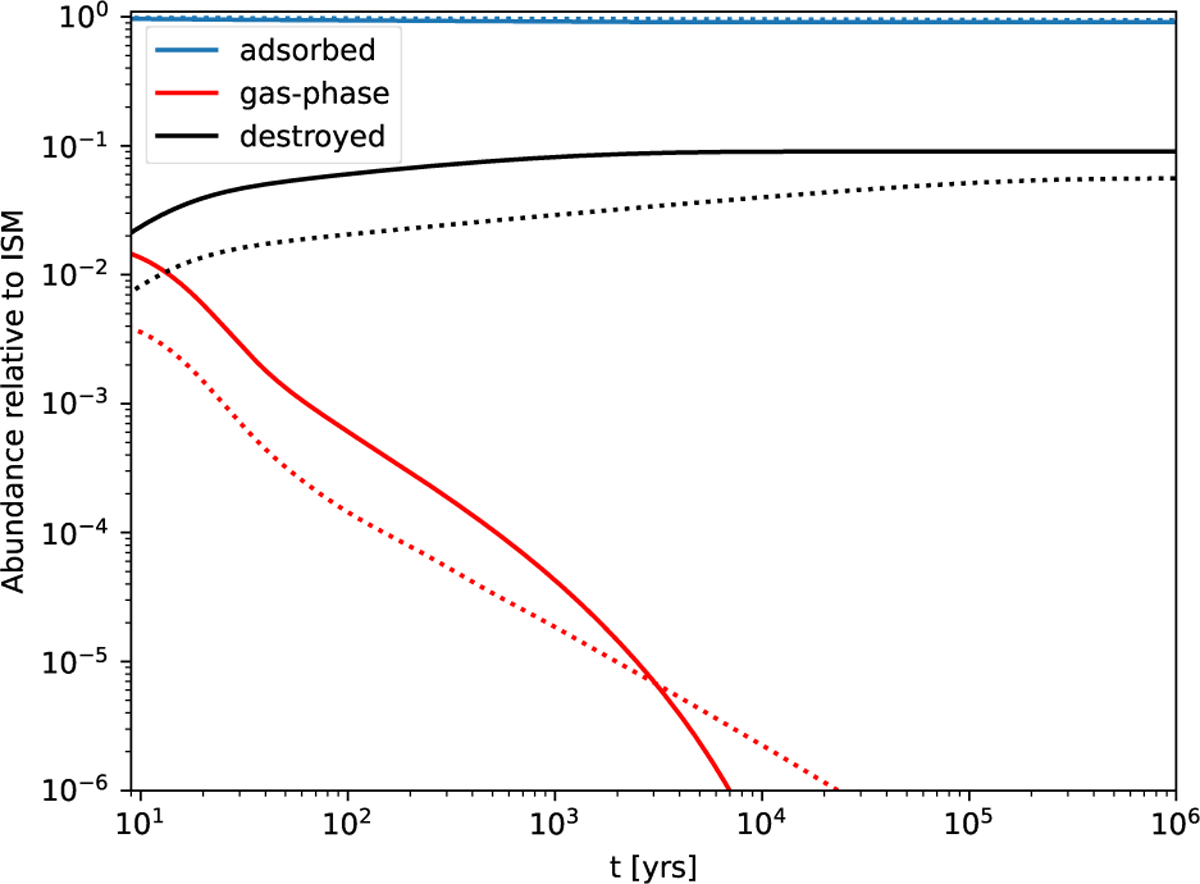
Fig. 8
Download original image
Summed abundance for all cluster sizes (coronene: solid lines, ovalene: dotted lines) relative to the ISM. All clusters that desorbed, dissociated, and then experienced C2H2 loss are marked in black. The resulting gas-phase monomer fraction resulting from the desorption and subsequent dissociation by X-rays is shown in red. Since most PAHs are adsorbed in the form of clusters with more than 25 molecules, the adsorbed fraction of PAHs hardly changes at all.
Current usage metrics show cumulative count of Article Views (full-text article views including HTML views, PDF and ePub downloads, according to the available data) and Abstracts Views on Vision4Press platform.
Data correspond to usage on the plateform after 2015. The current usage metrics is available 48-96 hours after online publication and is updated daily on week days.
Initial download of the metrics may take a while.