Fig. 2
Download original image
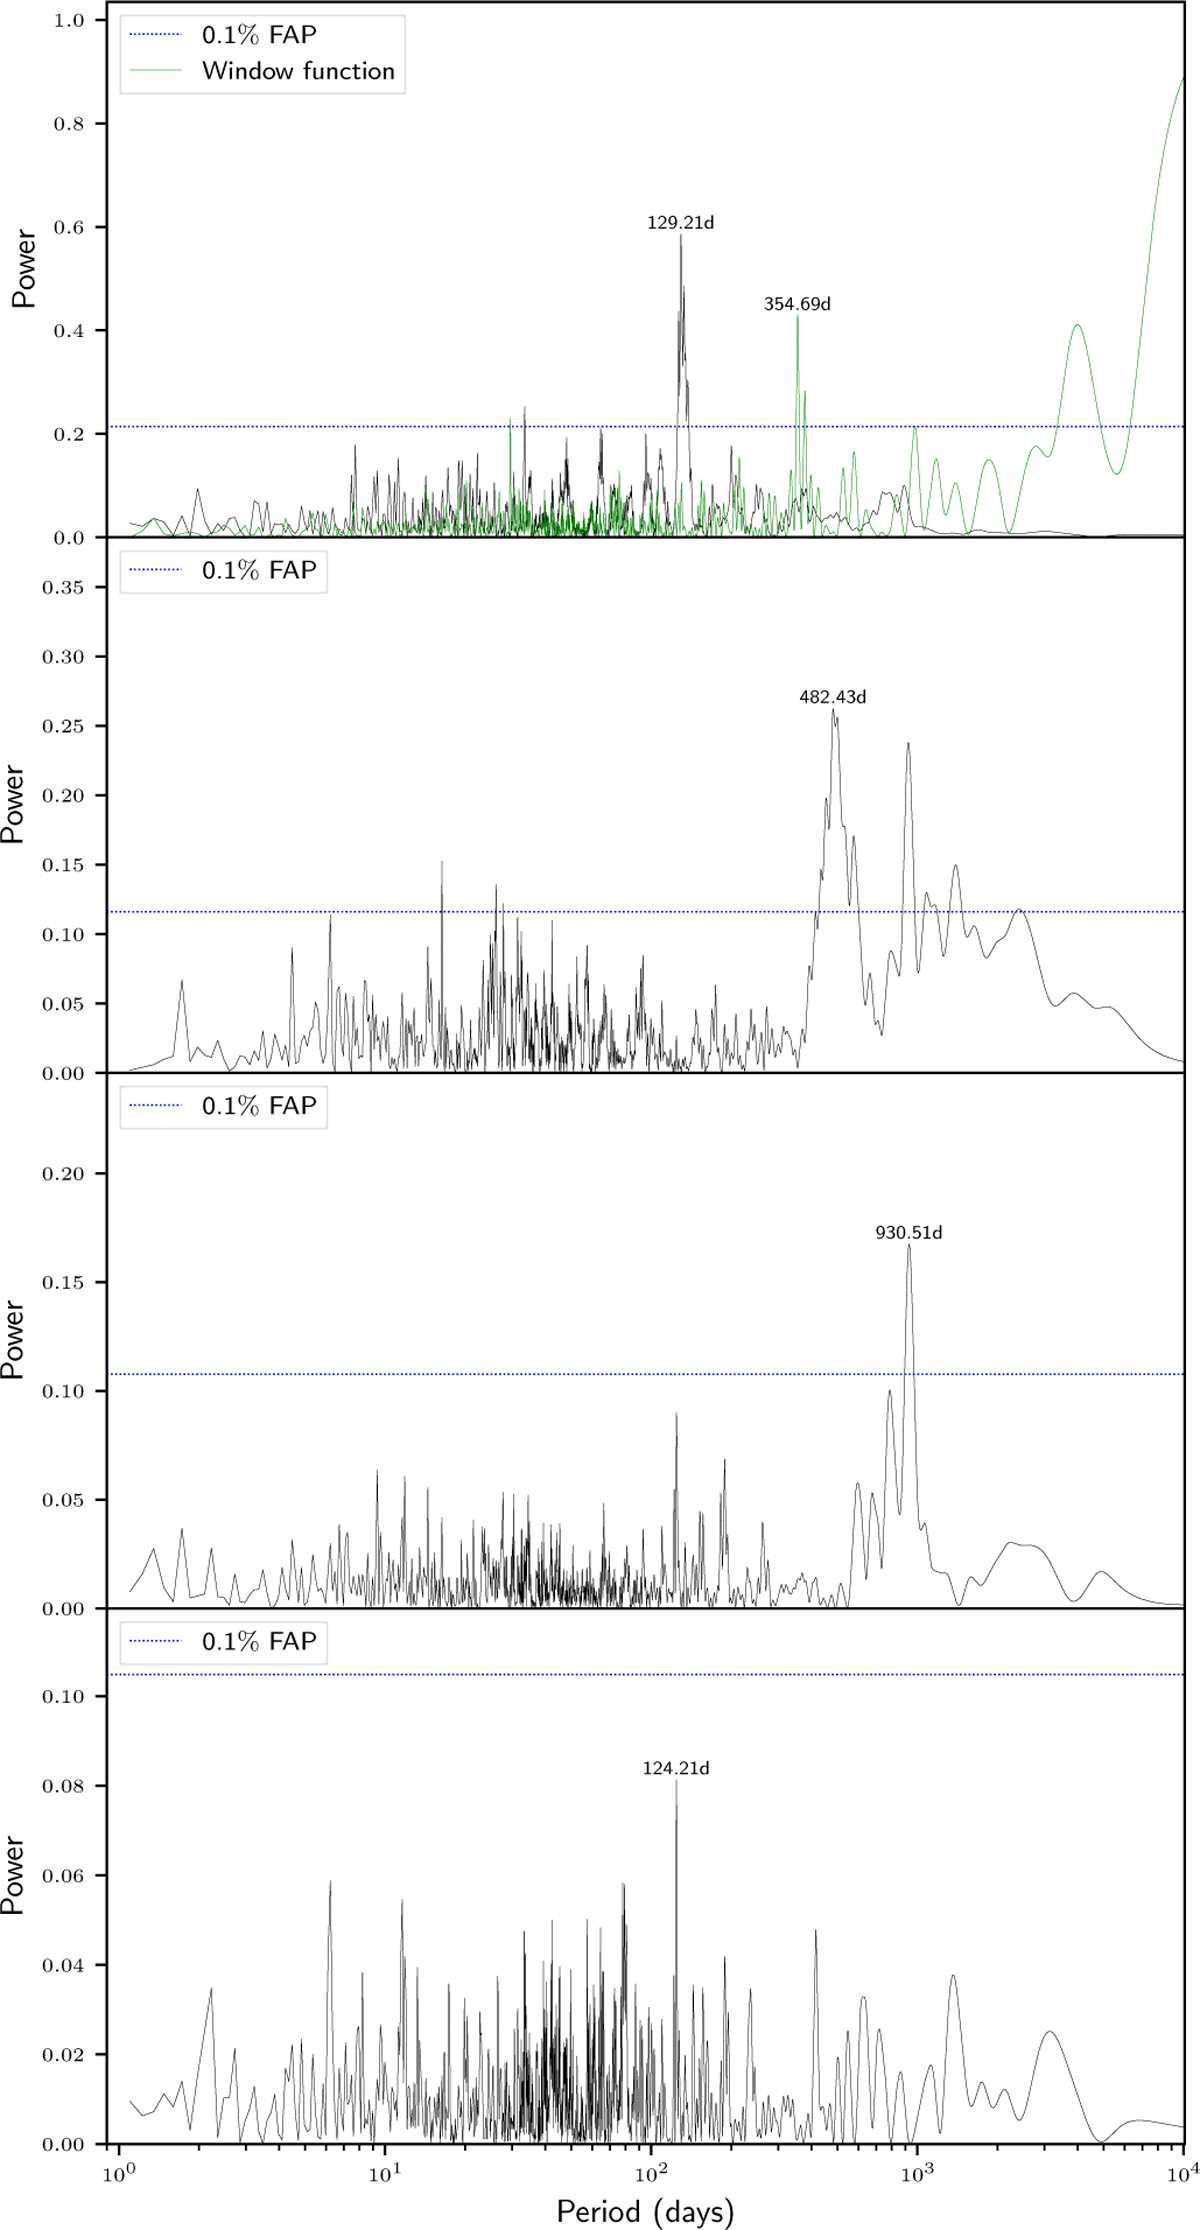
Top panel: original GLS periodogram of the combined and mean-subtracted RV data (black). The periodogram of the window function (sampling) for the combined data (green) is also shown. Second panel: GLS periodogram after fitting and removing the first detected signal. Third panel: GLS periodogram after fitting and removing both the first and second signals. Bottom panel: GLS periodogram after fitting and removing all three previously detected signals. The blue dotted horizontal lines represents the 0.1% false alarm probability level estimated from 5000 bootstrap resamplings.
Current usage metrics show cumulative count of Article Views (full-text article views including HTML views, PDF and ePub downloads, according to the available data) and Abstracts Views on Vision4Press platform.
Data correspond to usage on the plateform after 2015. The current usage metrics is available 48-96 hours after online publication and is updated daily on week days.
Initial download of the metrics may take a while.