Fig. 4
Download original image
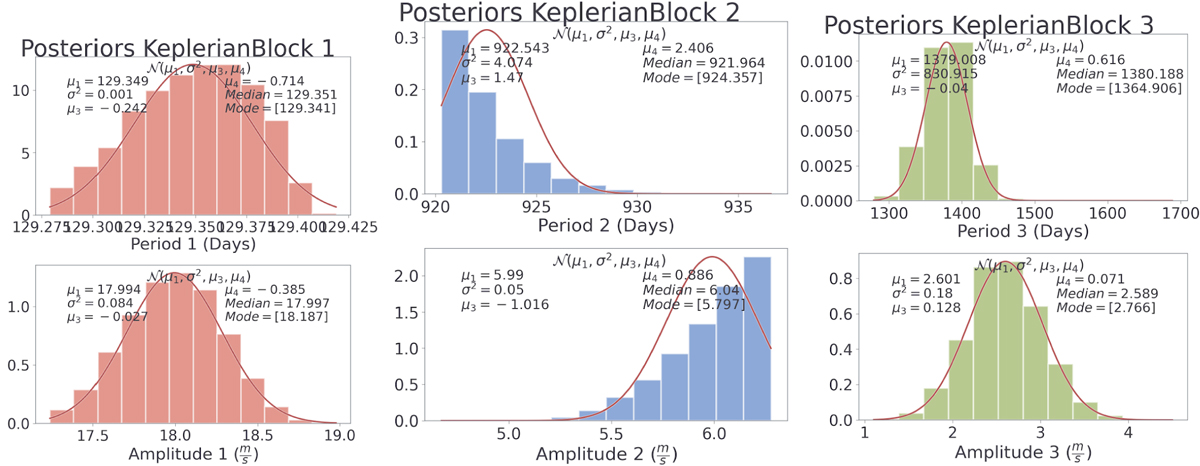
Top, left to right: final posterior distribution of the period for the first, second, and third Keplerians from the best-fitting parallel-tempered MCMC run. Bottom, left to right: final posterior distribution of the semi-amplitude for the first, second, and third Keplerians from the best-fitting parallel-tempered MCMC run. The numbers at the top of each figure correspond to the mean, variance, skewness, kurtosis, median, and mode, respectively. The solid line represents a Gaussian curve with the same mean and variance.
Current usage metrics show cumulative count of Article Views (full-text article views including HTML views, PDF and ePub downloads, according to the available data) and Abstracts Views on Vision4Press platform.
Data correspond to usage on the plateform after 2015. The current usage metrics is available 48-96 hours after online publication and is updated daily on week days.
Initial download of the metrics may take a while.