Fig. 5
Download original image
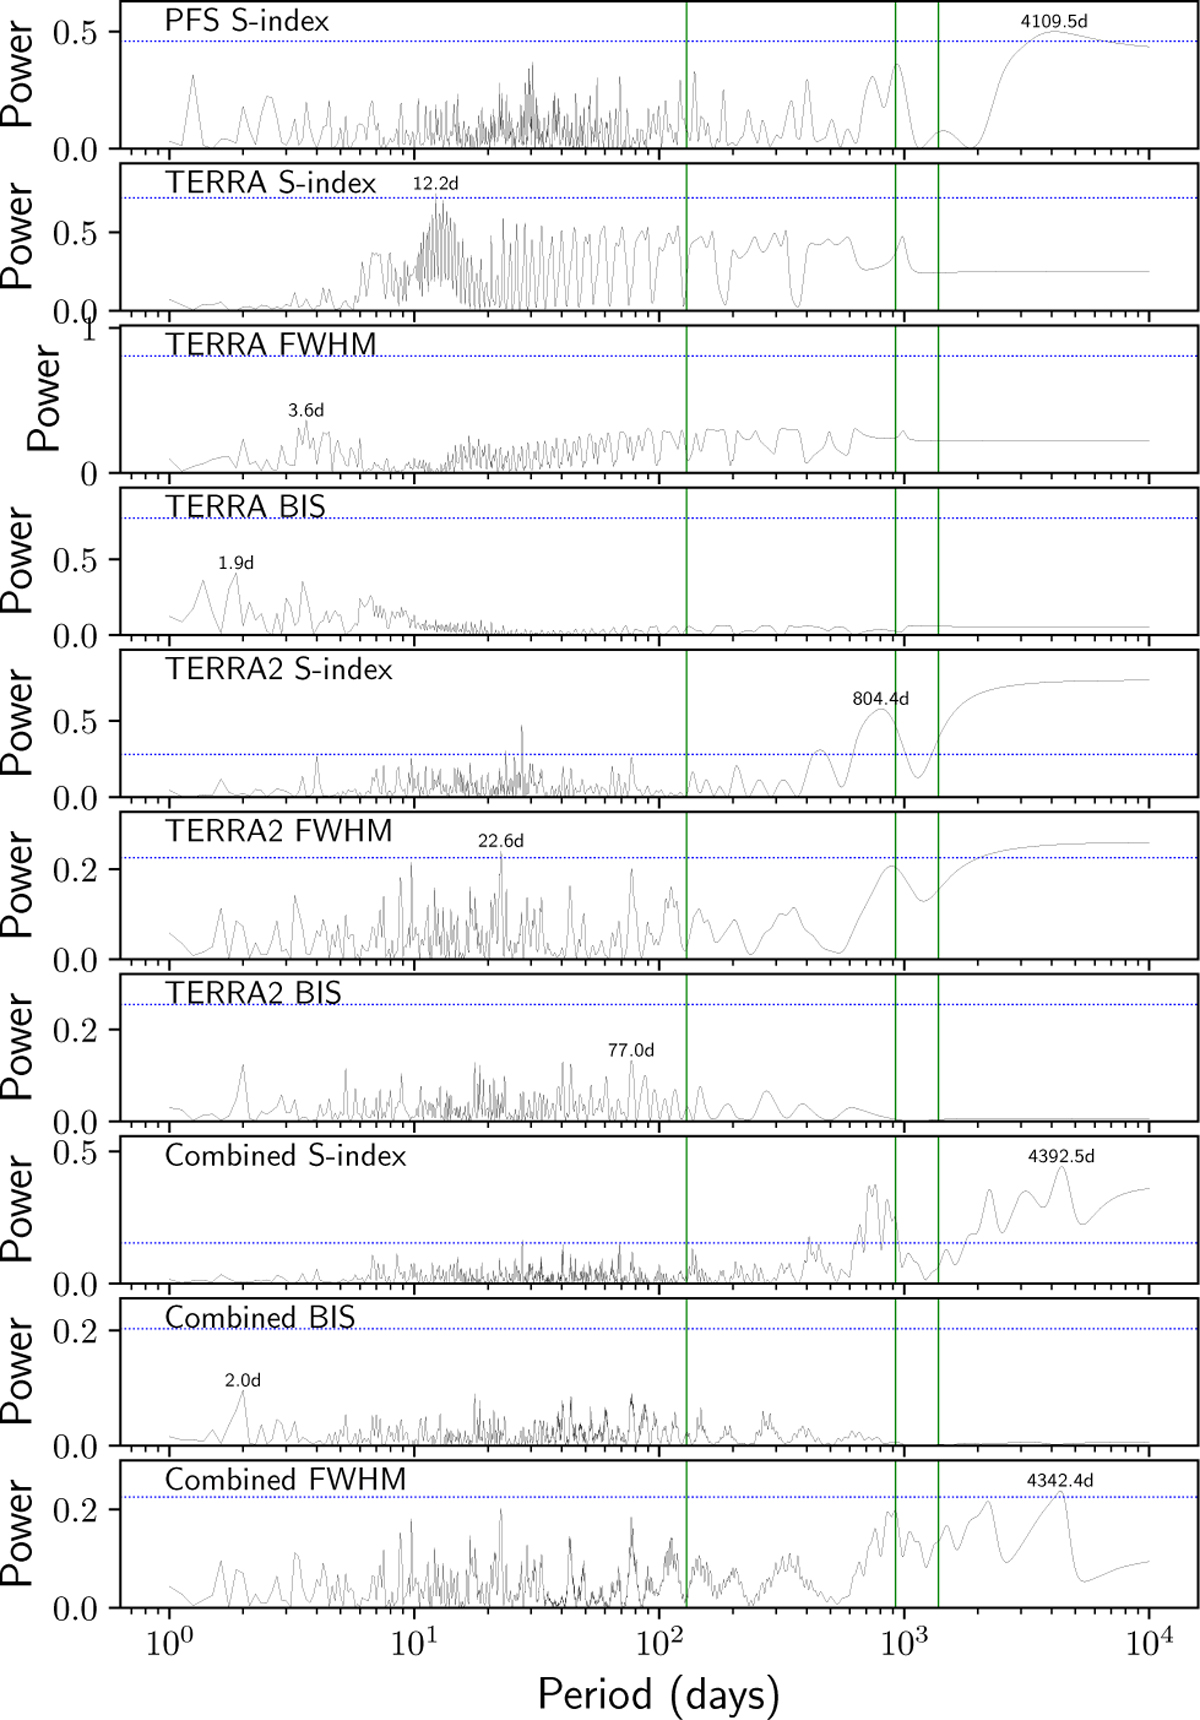
GLS periodogram of the available stellar activity indices. From top to bottom: PFS S-index, TERRA S-index, TERRA FWHM, TERRA BIS, TERRA2 S-index, TERRA2 FWHM, TERRA2 BIS, Combined Sindex, Combined BIS, Combined FWHM. The green solid vertical lines show the best-fit periods of the three planetary signals. The blue dotted horizontal lines represents the 0.1% false alarm probability (FAP) level estimated from 5000 bootstrap resamplings.
Current usage metrics show cumulative count of Article Views (full-text article views including HTML views, PDF and ePub downloads, according to the available data) and Abstracts Views on Vision4Press platform.
Data correspond to usage on the plateform after 2015. The current usage metrics is available 48-96 hours after online publication and is updated daily on week days.
Initial download of the metrics may take a while.