Fig. 2.
Download original image
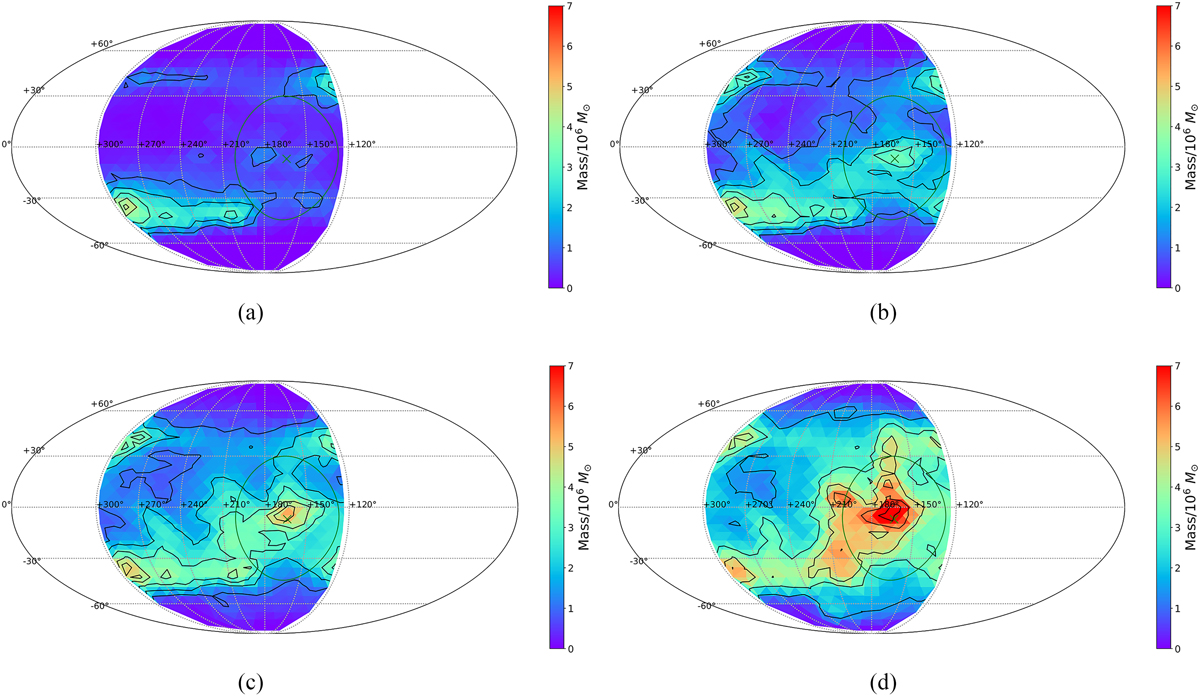
Tidal debris pole distribution at different Galactocentric distance (d) cuts from the present-day Banik et al. (2022) simulation data (represented with a Mollweide projection). All figures have a lower distance cut of z > 50 kpc to remove the contamination from the disc material. For a better comparison with the observed sample, we have also assumed that the simulated substructures are all orbiting with the same orbital sense (see Section 2), even though − unlike the observed data − the simulation does provide information on the orbital sense of its particles and gas cells. The green cross marks the position of the observed VPOS direction (l, b) = (164.0°, −6.9°) (Pawlowski et al. 2015) and the green circle surrounding it represents the threshold of the VPOS membership area considered in our statistical analysis (see Section 3). (a) Simulated tidal debris at d < 100 kpc. (b) Simulated tidal debris poles at d < 150 kpc. (c) Simulated tidal debris poles at d < 200 kpc. (d) Simulated tidal debris poles at d < 350 kpc.
Current usage metrics show cumulative count of Article Views (full-text article views including HTML views, PDF and ePub downloads, according to the available data) and Abstracts Views on Vision4Press platform.
Data correspond to usage on the plateform after 2015. The current usage metrics is available 48-96 hours after online publication and is updated daily on week days.
Initial download of the metrics may take a while.