Fig. B.1.
Download original image
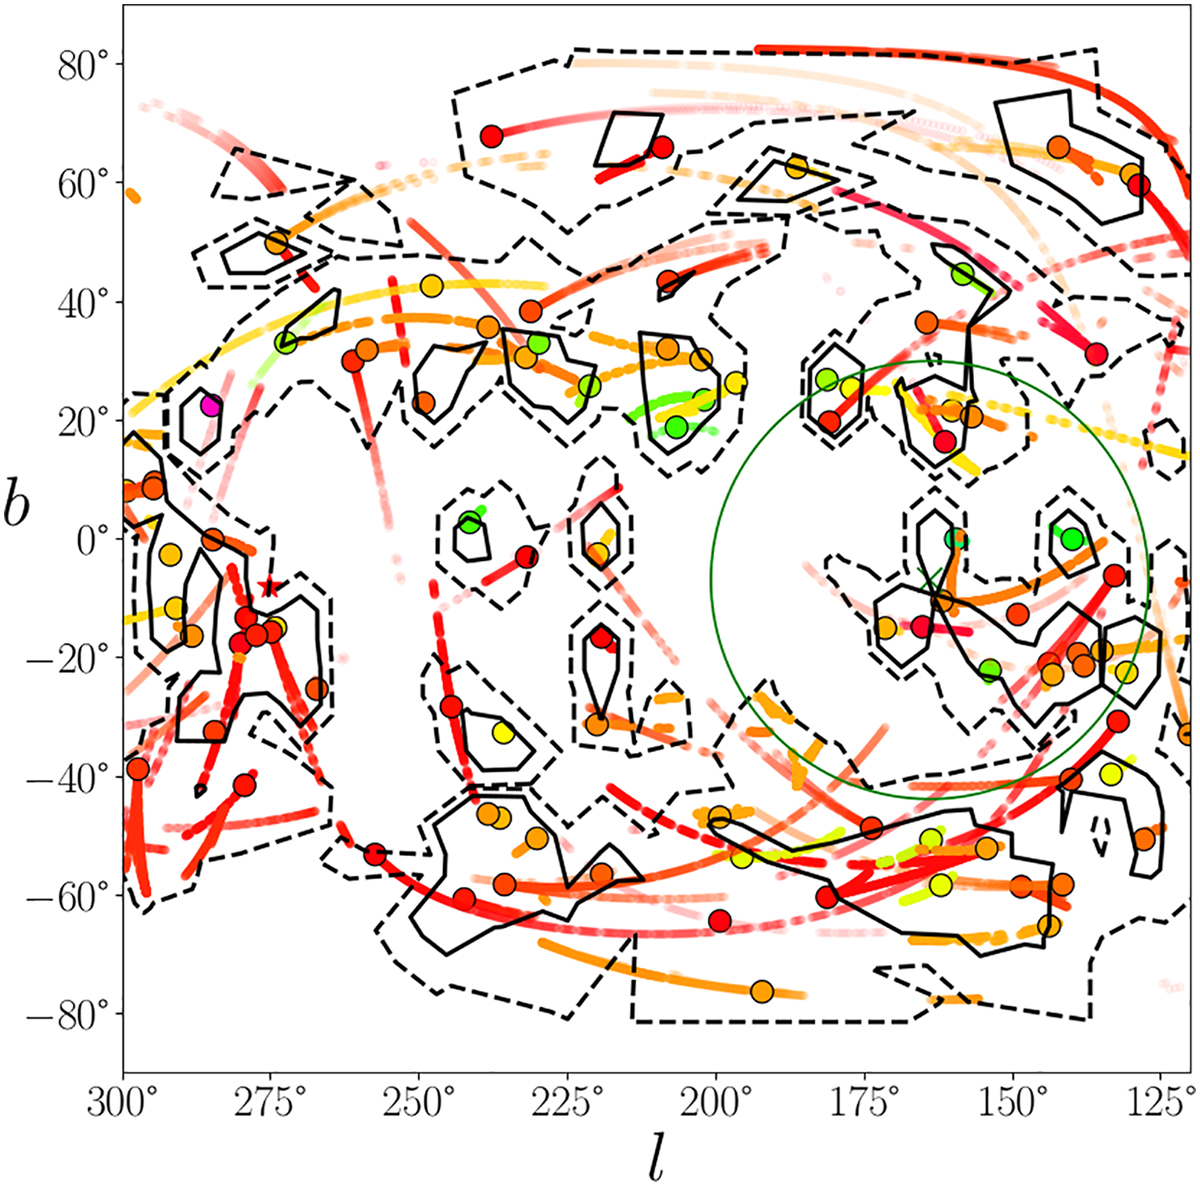
Figure similar to Fig. 1 but for a 2D projection. This figure also includes contour plots that enclose different stream pole areas as a function of their pole fraction. Solid lines correspond to a 1σ contour level and dashed lines correspond to a 2σ level in this plot. For obtaining the fraction of poles per bin, we divided the parameter space in 384 bins of equal area and we distributed the statistical ‘weight’ of each stream pole equally among its uncertainty pole track.
Current usage metrics show cumulative count of Article Views (full-text article views including HTML views, PDF and ePub downloads, according to the available data) and Abstracts Views on Vision4Press platform.
Data correspond to usage on the plateform after 2015. The current usage metrics is available 48-96 hours after online publication and is updated daily on week days.
Initial download of the metrics may take a while.