Open Access
Fig. D.2.
Download original image
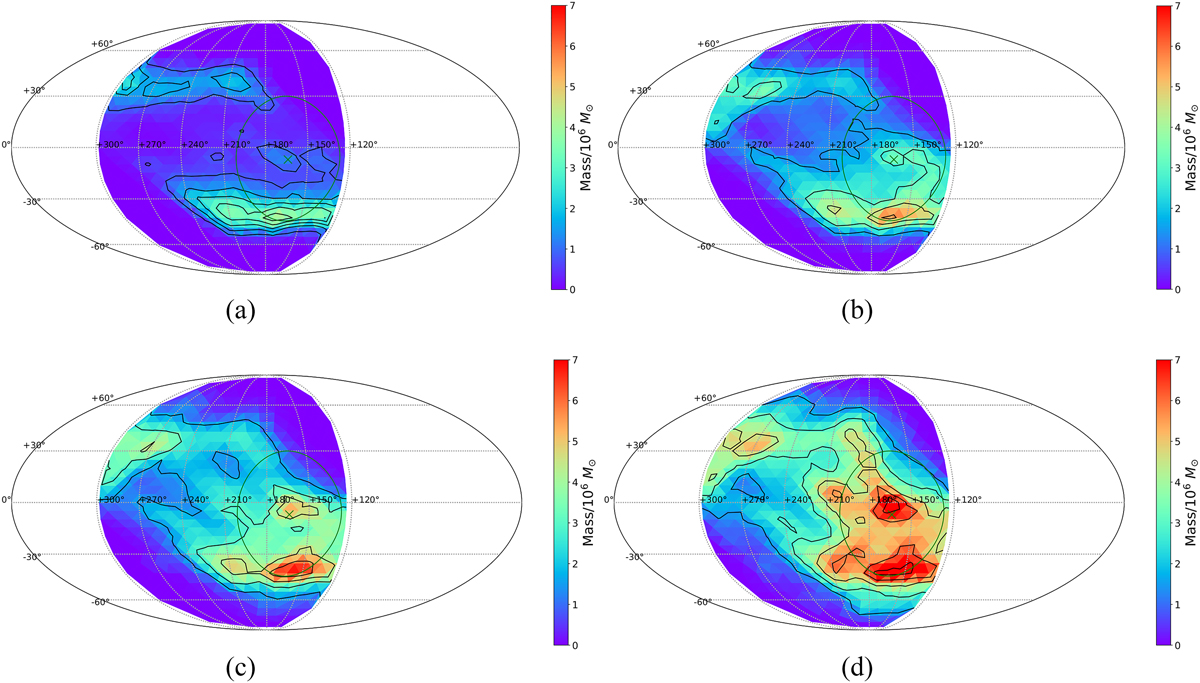
Figure showing the orbital pole distribution of the particles and gas cells in Fig. 2 after being back-traced for 6.6 Gyr using the precession rate formula (Eq.2). Note that the fraction of elements within the VPOS region increases significantly after being corrected for the effect of precession (see Fig. 2 for comparison).
Current usage metrics show cumulative count of Article Views (full-text article views including HTML views, PDF and ePub downloads, according to the available data) and Abstracts Views on Vision4Press platform.
Data correspond to usage on the plateform after 2015. The current usage metrics is available 48-96 hours after online publication and is updated daily on week days.
Initial download of the metrics may take a while.