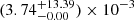
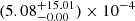
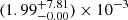
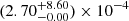
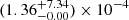
Table 2.
Bernoulli probability for the simulation sample.
| Distance cut | P (N = 100) | P (N = 300) | P (N = 500) |
|---|---|---|---|
| d < 100 kpc |  ( ( ) ) |
 ( ( ) ) |
 ( ( ) ) |
| d < 150 kpc | 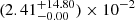 ( ( ) ) |
 ( ( ) ) |
 ( ( ) ) |
| d < 200 kpc | 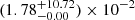 ( ( ) ) |
 ( ( ) ) |
 ( ( ) ) |
| d < 350 kpc | 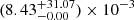 ( ( ) ) |
 ( ( ) ) |
 ( ( ) ) |
Notes. The P values represent the probability that, for a randomly selected sample, a homogeneous pole distribution provides the same (or higher) fraction of VPOS members as the pole distribution of the Banik et al. (2022) simulation. For example, according to this method, there is a  chance that, if 100 elements are randomly drawn from a homogeneous distribution with d < 350 kpc, these have the same or a higher fraction of VPOS members than 100 elements drawn from the anisotropic distribution of Banik et al. (2022) at this distance. The corresponding number of standard deviations is also indicated in parentheses. This probability was obtained at different upper distance cuts (d< ) and for different sample sizes (N), considering only one possible orbital sense (half l-parameter space). In these simulations, a lower distance cut in the z direction of z > 50 kpc was imposed to remove the disc contamination.
Current usage metrics show cumulative count of Article Views (full-text article views including HTML views, PDF and ePub downloads, according to the available data) and Abstracts Views on Vision4Press platform.
Data correspond to usage on the plateform after 2015. The current usage metrics is available 48-96 hours after online publication and is updated daily on week days.
Initial download of the metrics may take a while.