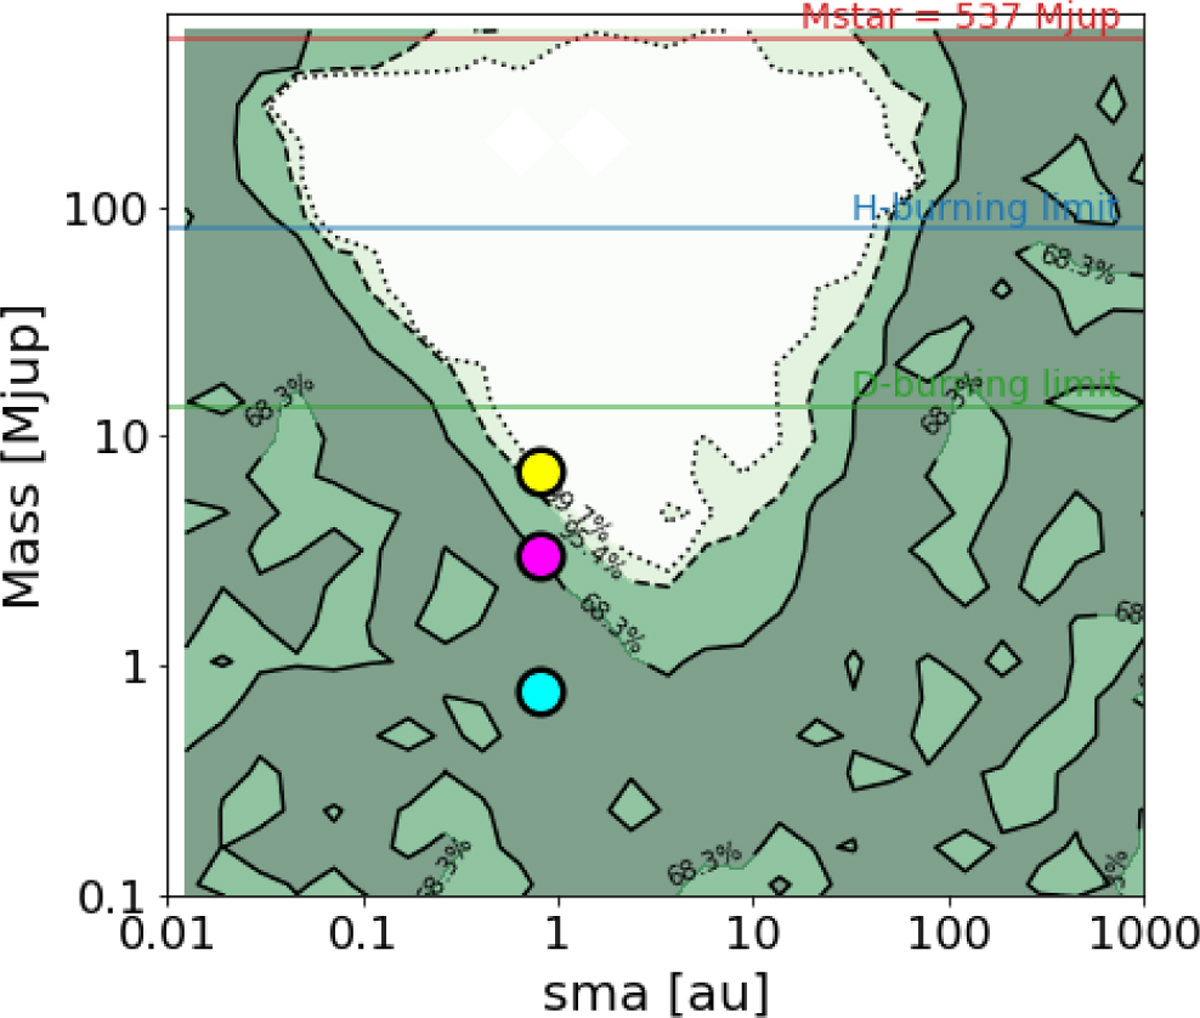
Fig. 10
Download original image
Same as Fig. 12 but for HIP 66074. Individual maps based on either PMa or ruwe only are shown in Fig. E.2. The yellow and cyan points show respectively the 7 and 0.79 MJ solutions at 0.8 au from the Gaia-NSS and the RV. The magenta point shows the solution at 3 MJ if the photocentric sma measured in the Gaia-NSS is overestimated by a factor 2, corresponding to an inclination of 13∘.
Current usage metrics show cumulative count of Article Views (full-text article views including HTML views, PDF and ePub downloads, according to the available data) and Abstracts Views on Vision4Press platform.
Data correspond to usage on the plateform after 2015. The current usage metrics is available 48-96 hours after online publication and is updated daily on week days.
Initial download of the metrics may take a while.