Fig. 6
Download original image
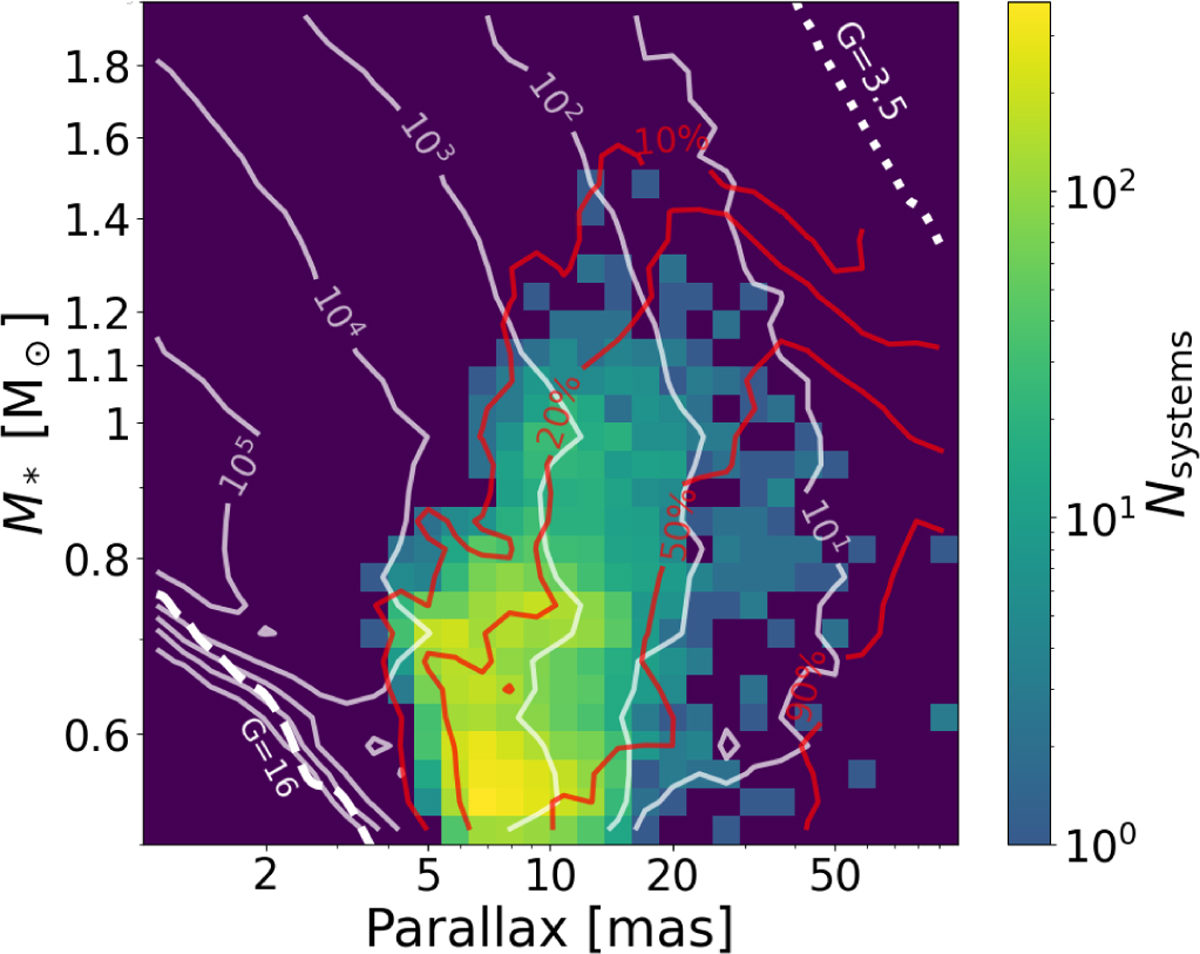
Number of detected planet candidates (per bin) with respect to parallax and M*. The sensitivity curve of Gaia for detecting 2–13.5 MJ companions at 1–3 au beyond a significance of 2.7–σ is overplotted in red showing the regions where more than 10, 20, 50 and 90% of companions are detected. The distribution of the Gaia sources satisfying steps 1–3 (Fig. 2) is also overplotted in white solid lines. The dashed thick white lines bound the region within the magnitude range of our sample, that is G-mag within 3.5–16.
Current usage metrics show cumulative count of Article Views (full-text article views including HTML views, PDF and ePub downloads, according to the available data) and Abstracts Views on Vision4Press platform.
Data correspond to usage on the plateform after 2015. The current usage metrics is available 48-96 hours after online publication and is updated daily on week days.
Initial download of the metrics may take a while.