Fig. 8
Download original image
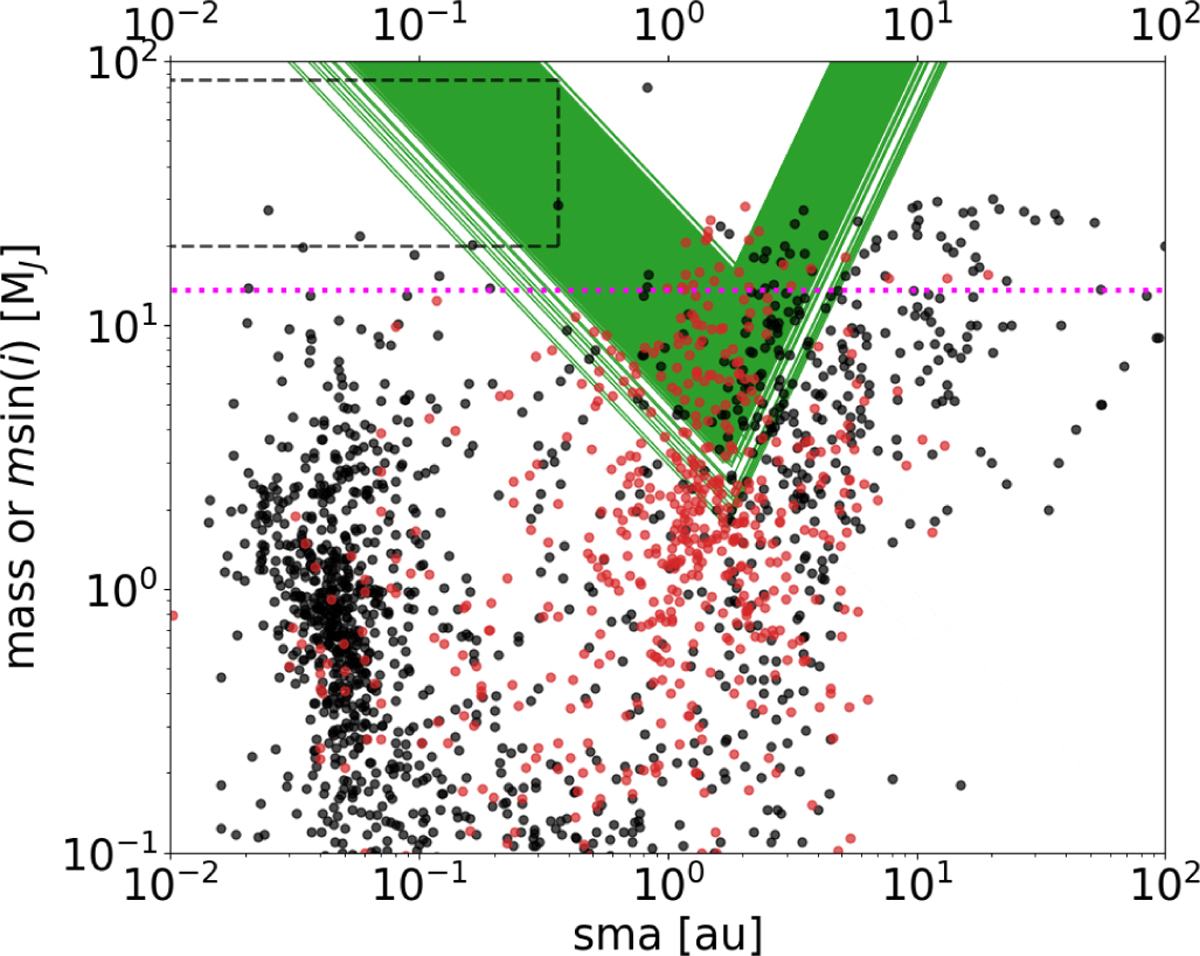
Mass-sma diagram of known exoplanets and planet candidates presented in the current work. The green lines show the degenerate mass and sma compatible with the GDR3 αUEVA. The data for exoplanets are taken from the NEA, including those with a known mass (black dots) and those with only a minimum mass m sin i (red dots). The black dashed lines bound the BD desert region extending up to orbital periods of 80 days (∼0.36 au for a 1 M⊙ host star; Kiefer et al. 2019, 2021). The magenta dotted line represents the commonly accepted 13.5 MJ upper-mass limit on the planetary domain.
Current usage metrics show cumulative count of Article Views (full-text article views including HTML views, PDF and ePub downloads, according to the available data) and Abstracts Views on Vision4Press platform.
Data correspond to usage on the plateform after 2015. The current usage metrics is available 48-96 hours after online publication and is updated daily on week days.
Initial download of the metrics may take a while.