Open Access
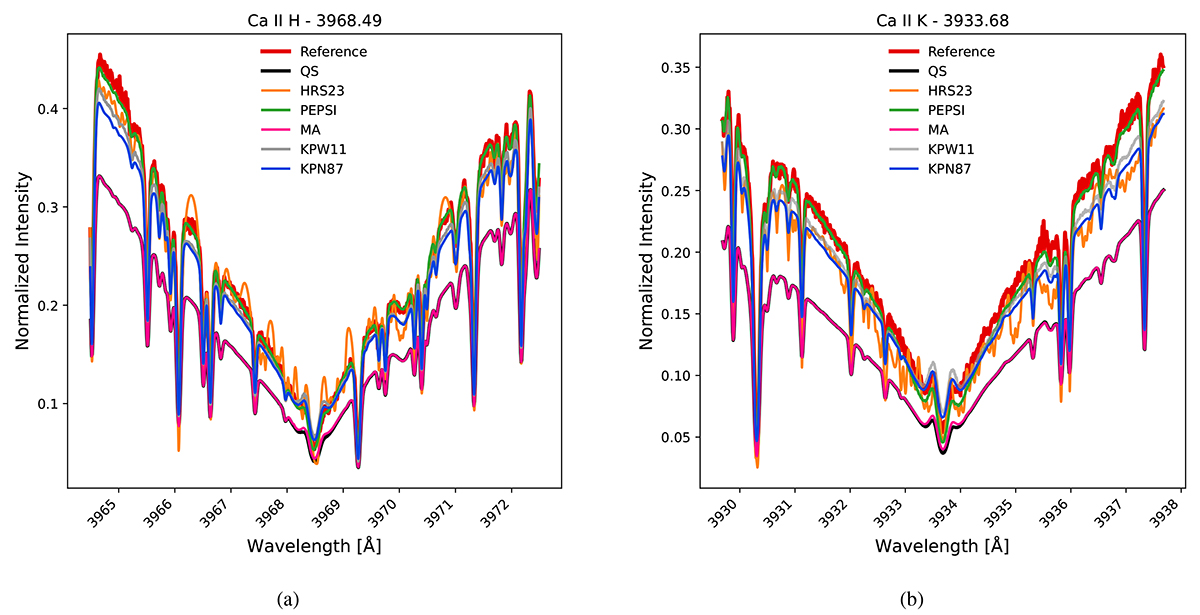
Fig. 10.
Download original image
Ca II H & K lines of all the atlases that cover this region overplotted together. The plots clearly show the intensity difference between our QS and MA atlases and the other atlases.
Current usage metrics show cumulative count of Article Views (full-text article views including HTML views, PDF and ePub downloads, according to the available data) and Abstracts Views on Vision4Press platform.
Data correspond to usage on the plateform after 2015. The current usage metrics is available 48-96 hours after online publication and is updated daily on week days.
Initial download of the metrics may take a while.