Open Access
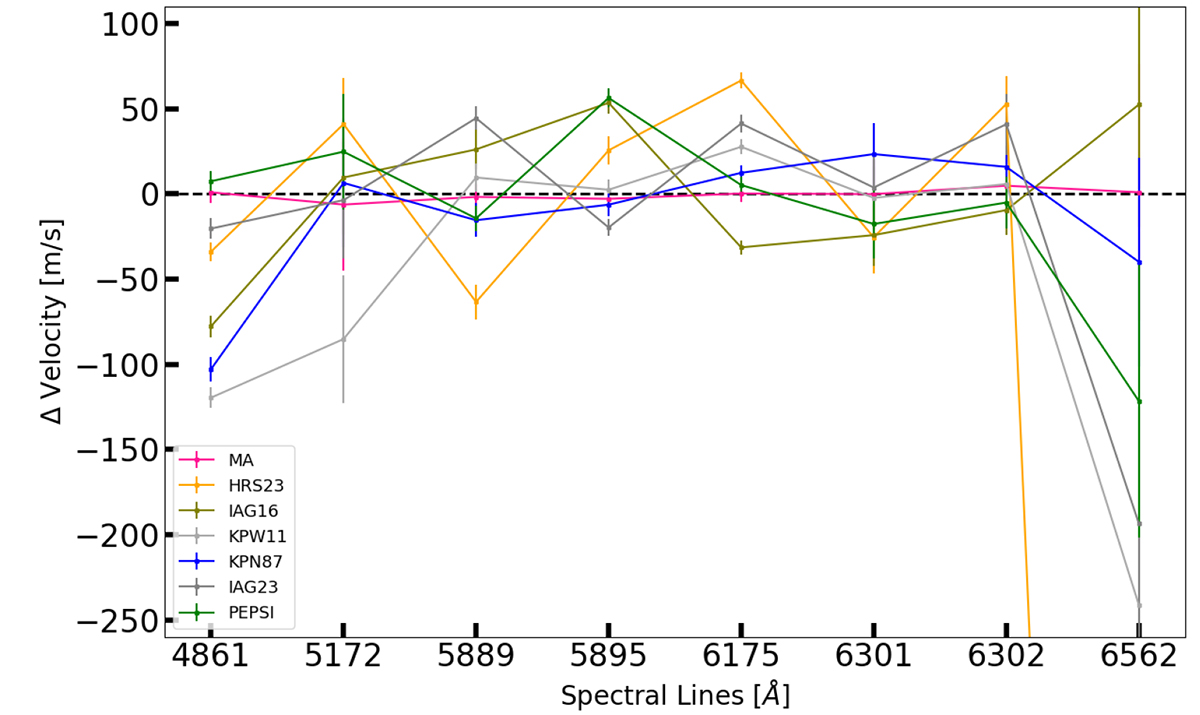
Fig. 15.
Download original image
RV deviation of individual spectral lines between the atlases, with the QS atlas serving as the reference. The error bars display the uncertainties obtained from the line-profile fitting procedure. The HRS23 RV for the Hα line is outside the visible range, as it is an outlier with a deviation in magnitude of 2.
Current usage metrics show cumulative count of Article Views (full-text article views including HTML views, PDF and ePub downloads, according to the available data) and Abstracts Views on Vision4Press platform.
Data correspond to usage on the plateform after 2015. The current usage metrics is available 48-96 hours after online publication and is updated daily on week days.
Initial download of the metrics may take a while.