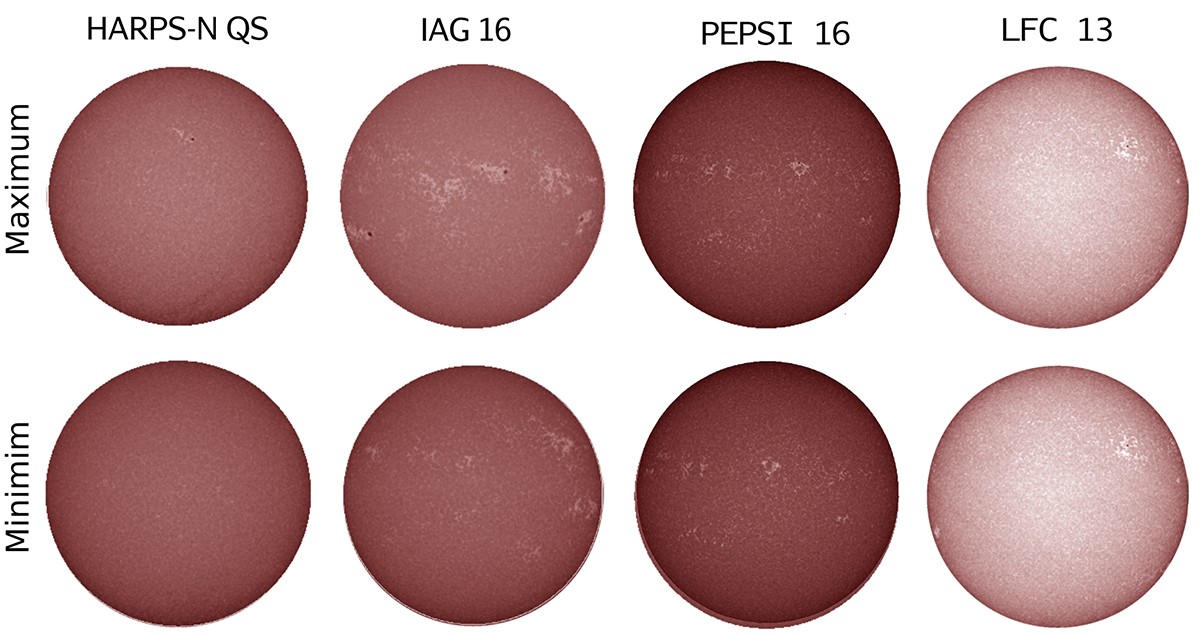
Fig. 2.
Download original image
Overview of atlas activity. Each disc on the top row represents the most active, with the highest spot number, day used for said atlas. The bottom row is the same except that it shows the lowest activity level for any given atlas. Data from the Solar Dynamics Observatory Atmospheric Imaging Assembly (SDO/AIA, Lemen et al. 2012) 1700 Å filter. Left: HARPS-N quiet Sun atlas, Reiners IAG flux atlas, PEPSI 2018 atlas, and Molaro LFC atlas. We note that the LFC atlas only has one data point, thus, it shows the same data twice.
Current usage metrics show cumulative count of Article Views (full-text article views including HTML views, PDF and ePub downloads, according to the available data) and Abstracts Views on Vision4Press platform.
Data correspond to usage on the plateform after 2015. The current usage metrics is available 48-96 hours after online publication and is updated daily on week days.
Initial download of the metrics may take a while.