Fig. 3.
Download original image
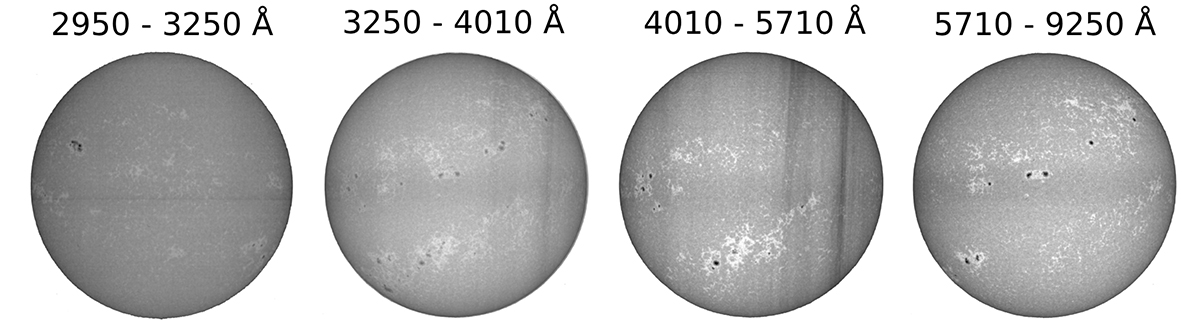
Illustrations of the solar disc during the times of the observations for the Wallace flux atlas, observed by the Meudon spectroheliogram (Malherbe & Dalmasse 2019; Malherbe et al. 2023). The images shown are taken in the Ca II K line core, for the times when the atlas observations were taken for each wavelength band, which makes-up the complete Wallace flux atlas. The images contain observational artefacts seen as nearly vertical stripes, most likely caused by clouds.
Current usage metrics show cumulative count of Article Views (full-text article views including HTML views, PDF and ePub downloads, according to the available data) and Abstracts Views on Vision4Press platform.
Data correspond to usage on the plateform after 2015. The current usage metrics is available 48-96 hours after online publication and is updated daily on week days.
Initial download of the metrics may take a while.