Fig. 5.
Download original image
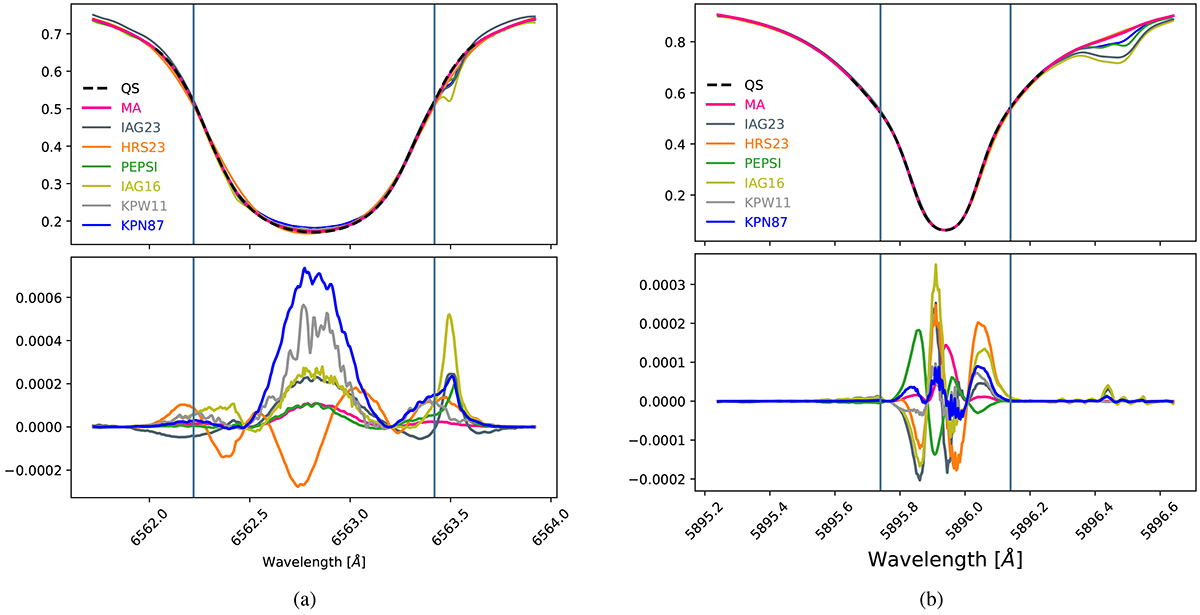
Illustration of how the activity number method transforms the intensity values of the spectral lines of other atlases. Top panels: the transformed spectral lines after being convolved and interpolated. The two vertical lines indicate the wavelength region used to calculate the activity number. Bottom panels: the remainder of the ratio differences, as described in Section 3.2. For HRS23, IAG16 and KPW11 atlases, the wavelengths were converted from vacuum to air using the formula from Birch & Downs (1994). (a) Hα, (b) Na D1.
Current usage metrics show cumulative count of Article Views (full-text article views including HTML views, PDF and ePub downloads, according to the available data) and Abstracts Views on Vision4Press platform.
Data correspond to usage on the plateform after 2015. The current usage metrics is available 48-96 hours after online publication and is updated daily on week days.
Initial download of the metrics may take a while.