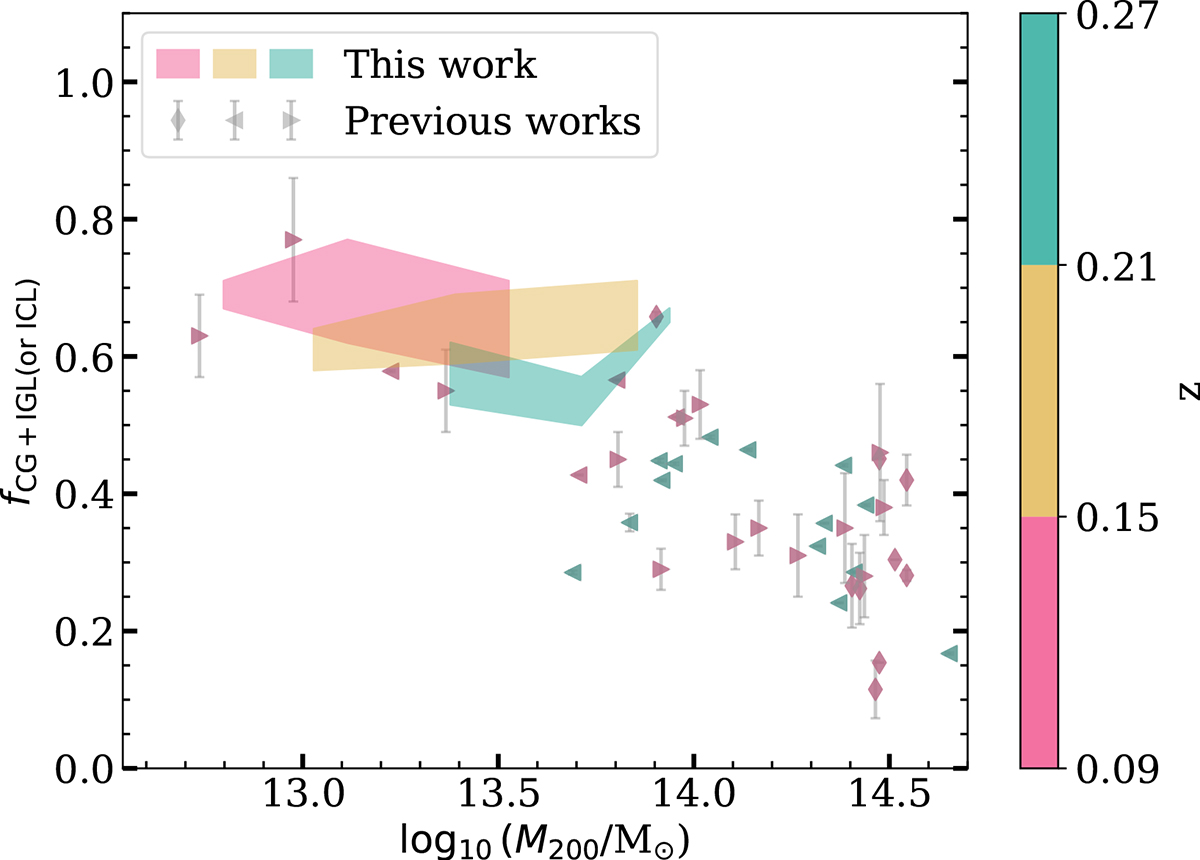
Fig. 10.
Download original image
Fraction of light in CG+IGL (or ICL) compared to the total group light (fCG + IGL(or ICL)) of the KiDS+GAMA groups at different redshifts from the 0th order (p0) background-subtracted images. The x-axis indicates the mean halo mass M200 of the corresponding bins for this work (shaded regions), and the group/cluster halo mass for the previous works (different markers). Pink, yellow, and cyan shaded regions show the upper and lower limit of fCG + IGL for the redshift ranges 0.09 < z < 0.15, 0.16 < z < 0.21, and 0.21 < z < 0.27, respectively. The diamonds, left-facing-triangles, and right-facing-triangles show previous works from Kluge et al. (2021), Furnell et al. (2021), and Gonzalez et al. (2007), respectively. The redshift ranges of the previous works are shown in the colourbar. Our results agree with a high fCG + IGL value for low halo masses.
Current usage metrics show cumulative count of Article Views (full-text article views including HTML views, PDF and ePub downloads, according to the available data) and Abstracts Views on Vision4Press platform.
Data correspond to usage on the plateform after 2015. The current usage metrics is available 48-96 hours after online publication and is updated daily on week days.
Initial download of the metrics may take a while.