Fig. A.1.
Download original image
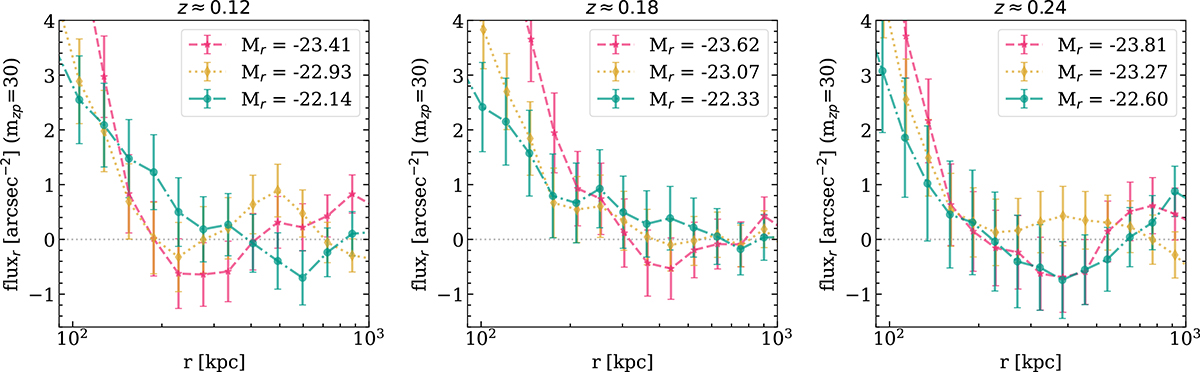
Radial flux profiles of the stacked CG galaxies for all the redshift and magnitude bins in this work. The mean redshift of each subset is shown in the title of the panel, and the mean magnitude of the bins in each redshift is shown in the labels. The brightest bin is shown in red dashed line, the intermediate magnitude bin is shown in yellow dotted line, and the faintest bin is shown in green dash-dotted line. To highlight the light retention in the outer region, the profiles are zoomed-in beyond 100 kpc from the galaxy centre.
Current usage metrics show cumulative count of Article Views (full-text article views including HTML views, PDF and ePub downloads, according to the available data) and Abstracts Views on Vision4Press platform.
Data correspond to usage on the plateform after 2015. The current usage metrics is available 48-96 hours after online publication and is updated daily on week days.
Initial download of the metrics may take a while.