Fig. 2.
Download original image
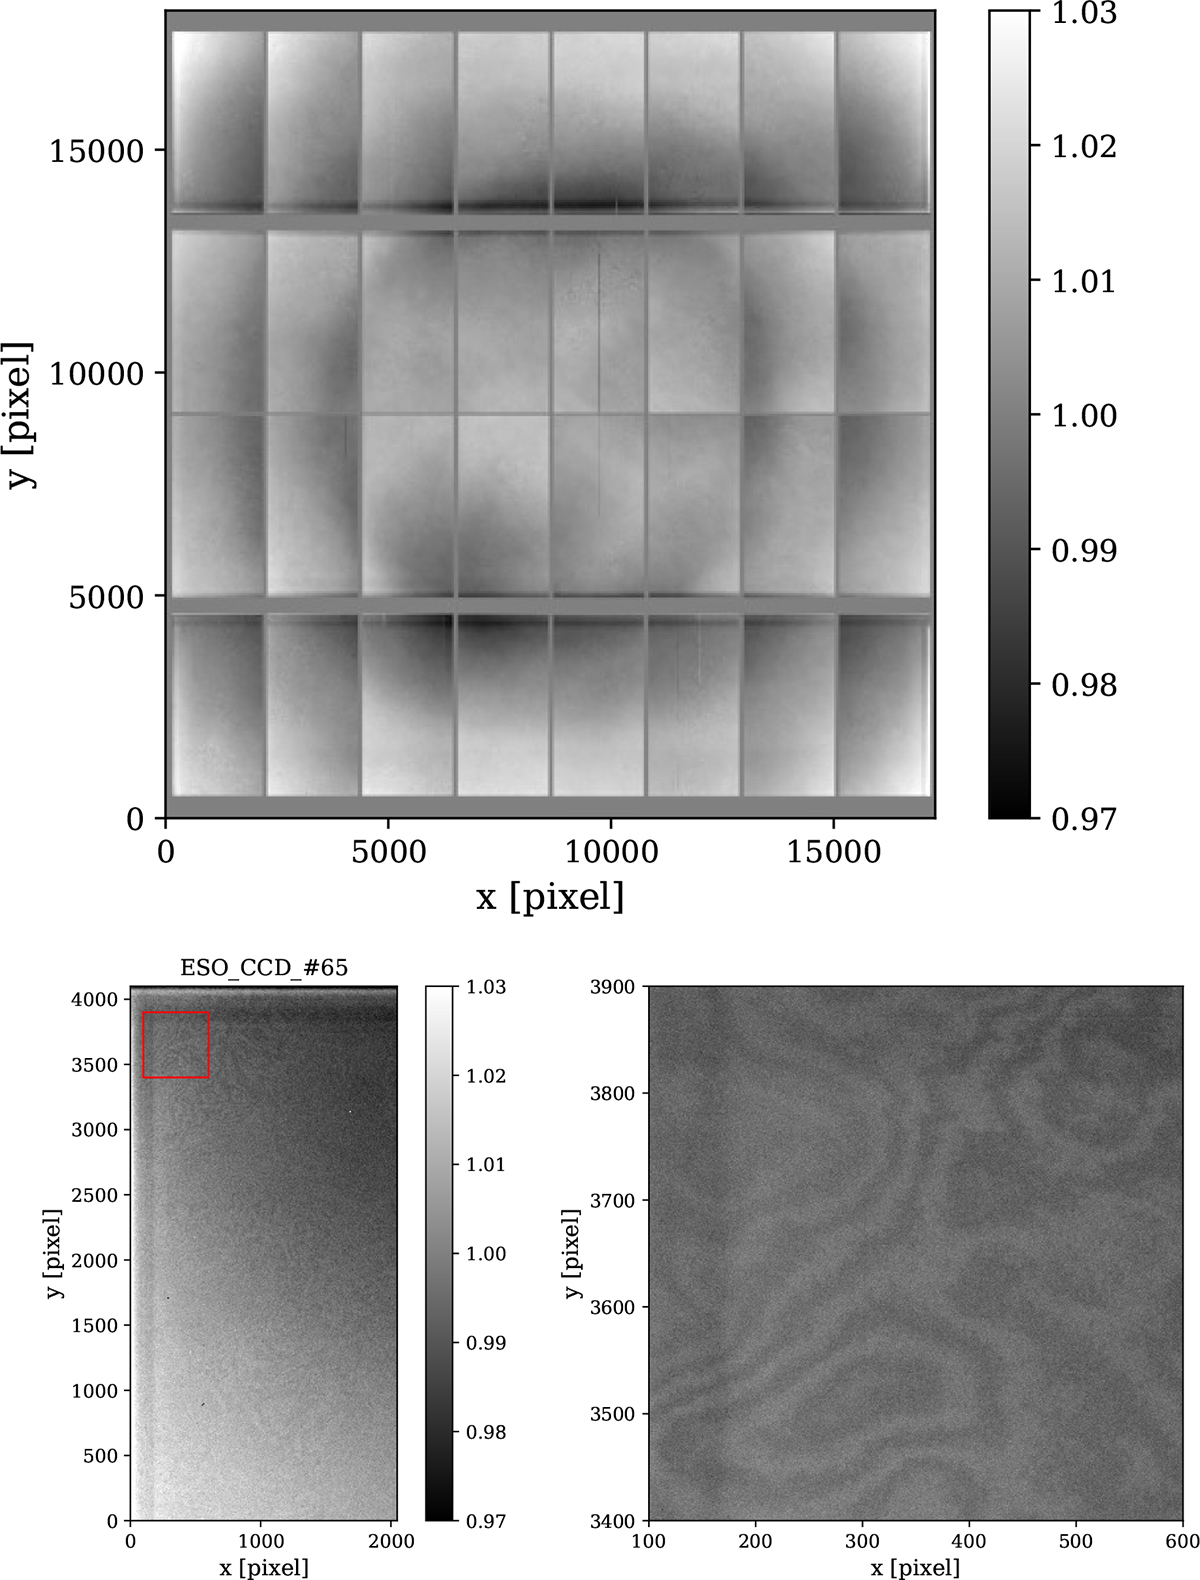
Flat-field data (delta flat) in the r-band obtained by averaging the science observations that were already flat-fielded using the standard ASTROWISE pipeline. The values shown in the colorbars represent the (dimensionless) relative change with respect to the original flatfield. The top panel shows the full mosaic. The bottom figures show the bottom-left chip with a zoom-in of the top-left corner of that chip (red square). Some structure is visible, likely due to variations in the illumination, as well as some low-level fringing.
Current usage metrics show cumulative count of Article Views (full-text article views including HTML views, PDF and ePub downloads, according to the available data) and Abstracts Views on Vision4Press platform.
Data correspond to usage on the plateform after 2015. The current usage metrics is available 48-96 hours after online publication and is updated daily on week days.
Initial download of the metrics may take a while.