Fig. 3.
Download original image
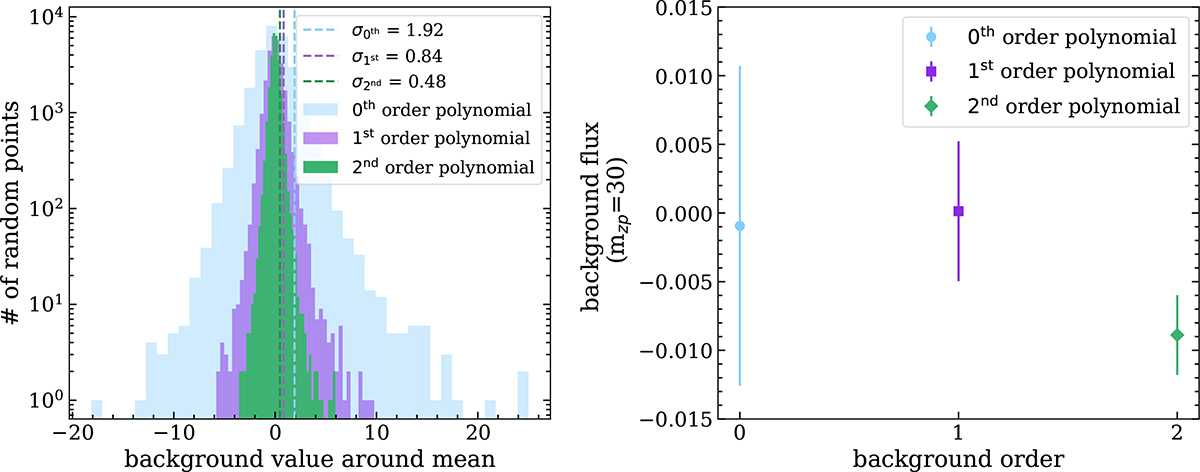
Left: Histogram of the background values in randomly placed annuli on the field images with polynomial sky subtractions of order 0 (blue), 1 (purple), and 2 (green). The vertical lines denote the corresponding 1σ values, as shown in the upper right corner. The scatter to the background values is smaller for higher-order polynomial estimation of the background. It is clear that higher-order polynomials remove spatial variation in the background more efficiently. Right: Mean and scatter of the mean background values for the different polynomial background estimations (indicated in the upper right corner). This again demonstrates how the scatter is gradually reduced for higher-order polynomial estimation to the background values.
Current usage metrics show cumulative count of Article Views (full-text article views including HTML views, PDF and ePub downloads, according to the available data) and Abstracts Views on Vision4Press platform.
Data correspond to usage on the plateform after 2015. The current usage metrics is available 48-96 hours after online publication and is updated daily on week days.
Initial download of the metrics may take a while.