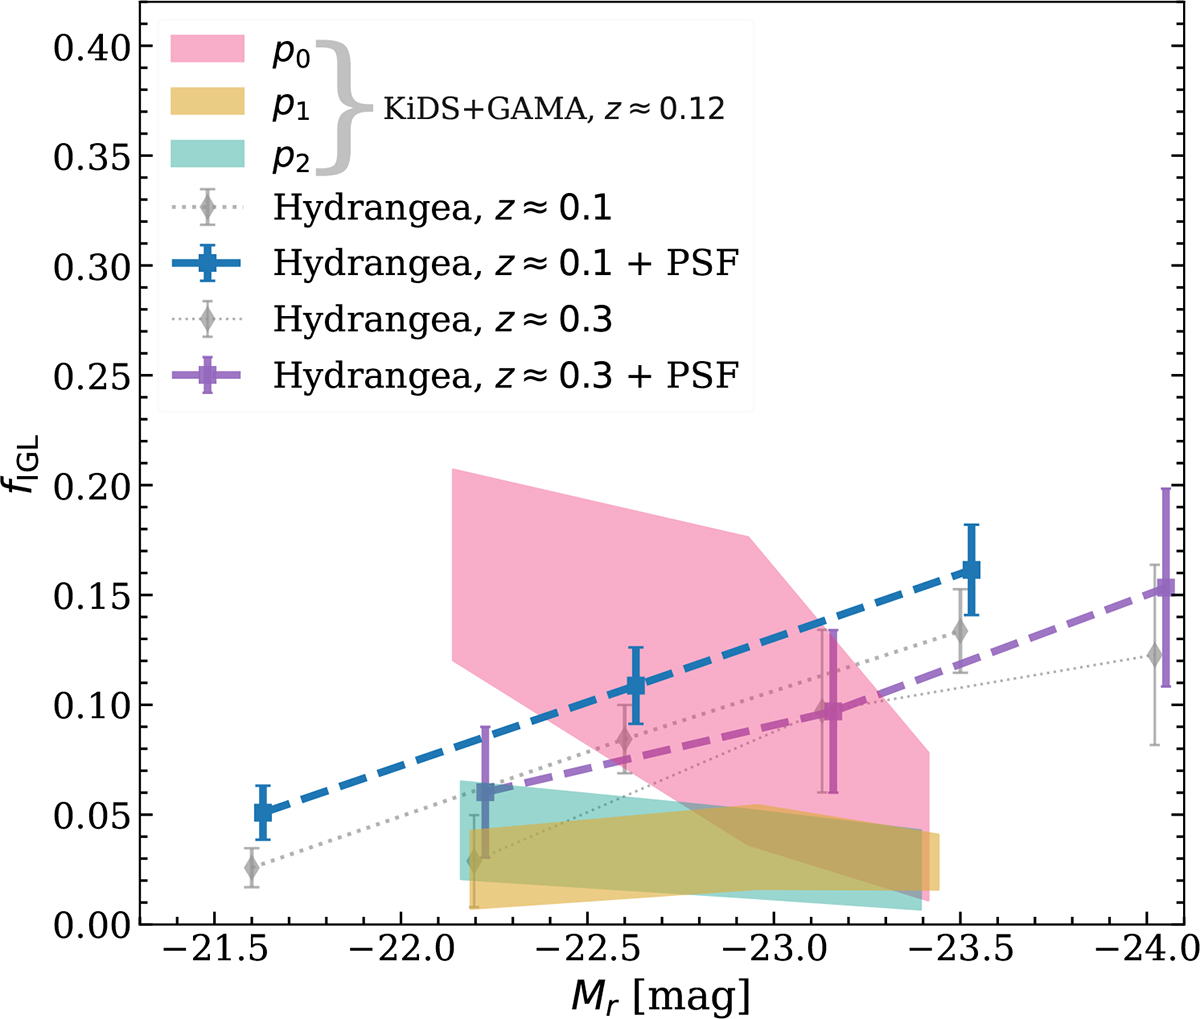
Fig. 6.
Download original image
Fraction of light in IGL compared to the total group light (fIGL) of our KiDS+GAMA group sample at 0.09 < z < 0.15 in the narrow bins of the CG galaxy they were stacked. The values along the x-axis indicate the mean Mr of the corresponding bins. Pink, yellow, and cyan shaded regions show the upper and lower limit of fIGL for the zeroth- (p0), first- (p1), and second- (p2) order background-subtracted images, respectively. Here, the p0 measurement is the upper limit of fIGL for each magnitude bin at this redshift bin, while p1 and p2 measurements provide a lower limit. Details on how we define the upper and lower limits for each of the measurements are discussed in the text. The dotted and dashed lines show the effect of the PSF on the measurements at redshifts 0.1 and 0.3 from the Hydrangea simulations.
Current usage metrics show cumulative count of Article Views (full-text article views including HTML views, PDF and ePub downloads, according to the available data) and Abstracts Views on Vision4Press platform.
Data correspond to usage on the plateform after 2015. The current usage metrics is available 48-96 hours after online publication and is updated daily on week days.
Initial download of the metrics may take a while.