Fig. 7.
Download original image
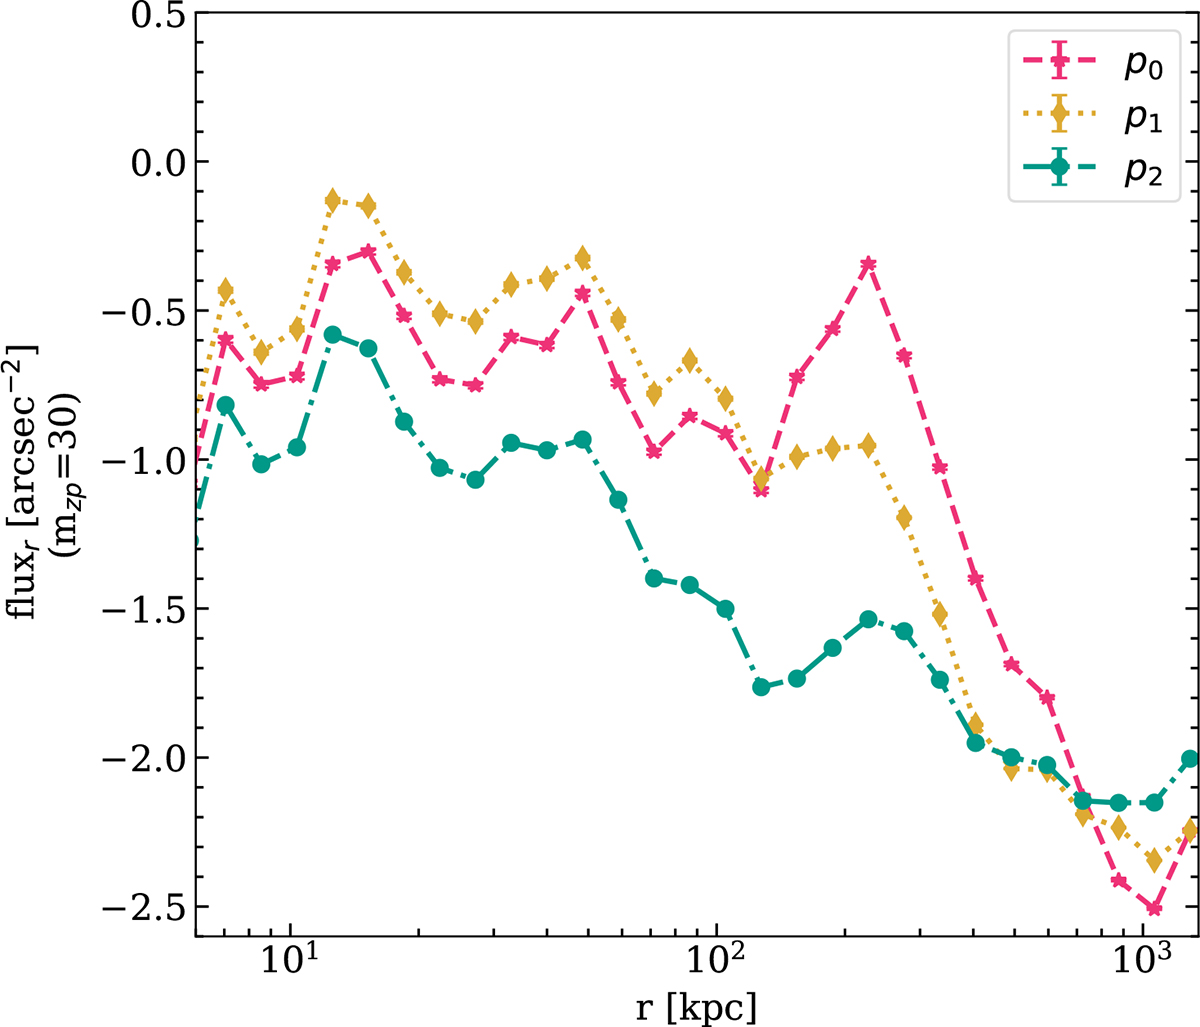
SB profile of the mean residual background at random points for the three background-subtracted field images used in this work. The error bars indicate the 1-σ scatter to the mean of the stacked background profiles. From the central region out to 100 kpc, the variation for p0 and p1 is similar, with p2 having a radially increasing offset from the other two. Beyond 200 kpc, the zeroth-order background-subtracted images (p0) have a steeper downturn than the other two. While p1 has a similar trend as p0, it is less steep. The downturn in p2 is more gradual compared to the other two. However, for all three cases, the background reaches comparable values at ∼1 Mpc distance from the centre.
Current usage metrics show cumulative count of Article Views (full-text article views including HTML views, PDF and ePub downloads, according to the available data) and Abstracts Views on Vision4Press platform.
Data correspond to usage on the plateform after 2015. The current usage metrics is available 48-96 hours after online publication and is updated daily on week days.
Initial download of the metrics may take a while.