Fig. 9.
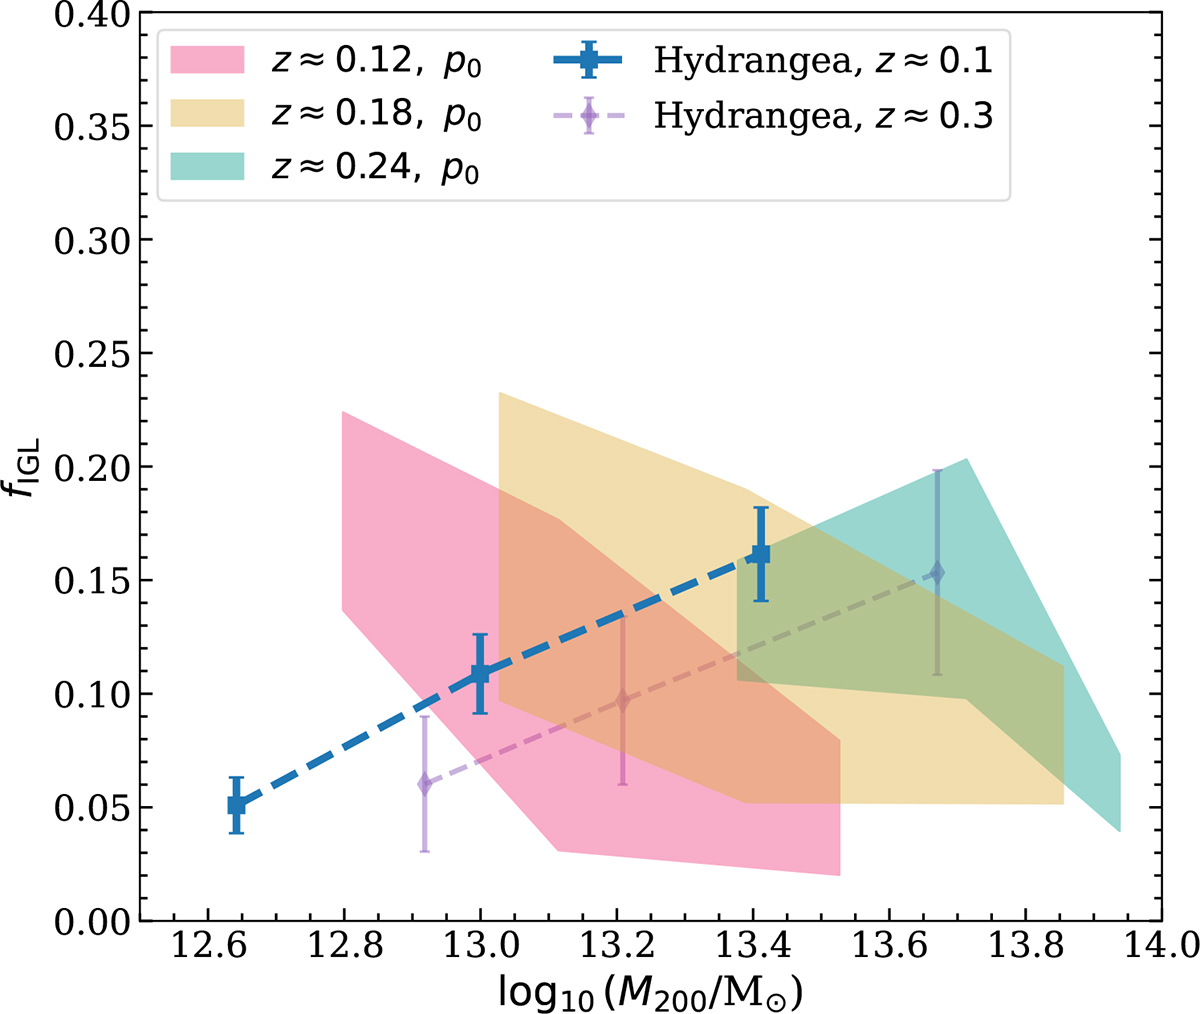
Download original image
Fraction of light in IGL compared to the total group light (fIGL) of the KiDS+GAMA groups at different redshifts from the 0th order (p0) background-subtracted images. The x-axis indicates the mean halo mass Mh of the corresponding bin. Pink, yellow, and cyan shaded regions show the upper and lower limit of fIGL for the redshift ranges 0.09 < z < 0.15, 0.16 < z < 0.21, and 0.21 < z < 0.27, respectively. Blue and purple lines show prediction of fIGL from the Hydrangea simulations at comparable redshifts (mentioned in labels). The range of fIGL is comparable between simulations and observations.
Current usage metrics show cumulative count of Article Views (full-text article views including HTML views, PDF and ePub downloads, according to the available data) and Abstracts Views on Vision4Press platform.
Data correspond to usage on the plateform after 2015. The current usage metrics is available 48-96 hours after online publication and is updated daily on week days.
Initial download of the metrics may take a while.