Open Access
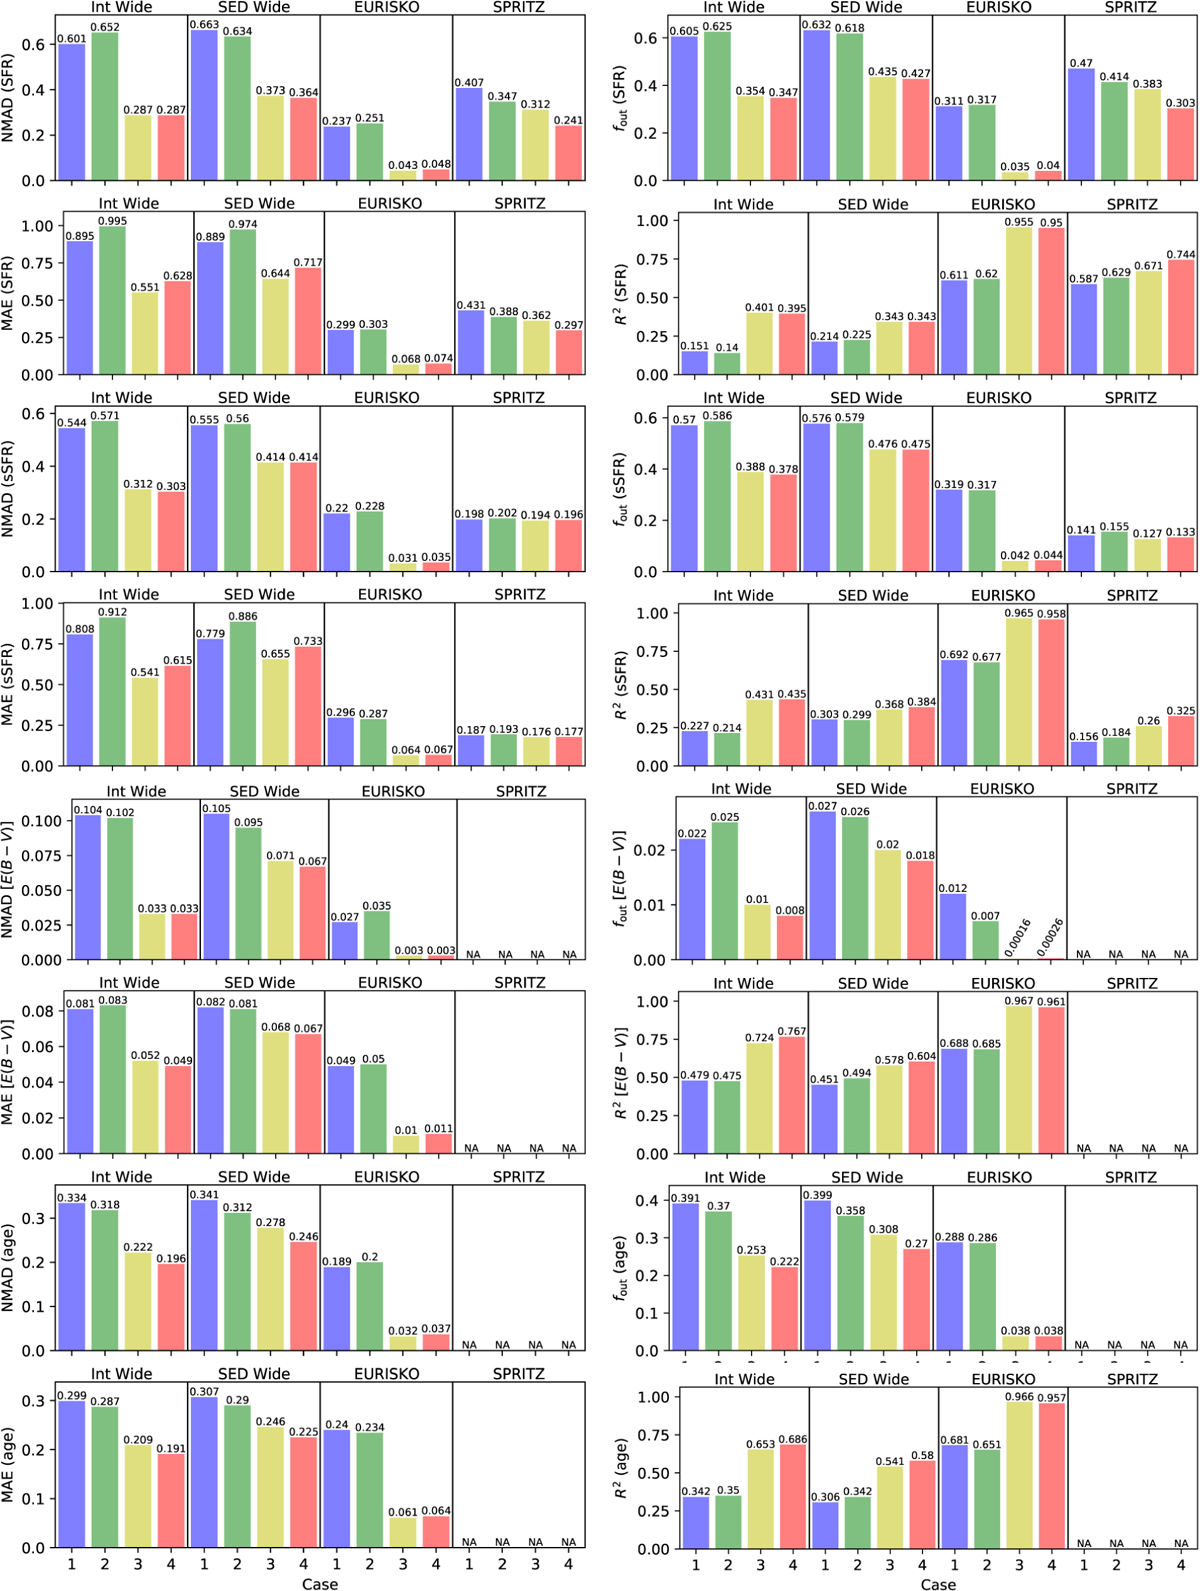
Fig. B.3
Download original image
Similar to Fig. 9: Bar charts showing the NMAD, fout, MAE, and R2 metrics for the predictions of SFR, sSFR, E(B − V), and age. The x-axis separates the results by case and catalogue. ‘NA’ indicates that a quantity was not among the predicted labels for that particular mock catalogue.
Current usage metrics show cumulative count of Article Views (full-text article views including HTML views, PDF and ePub downloads, according to the available data) and Abstracts Views on Vision4Press platform.
Data correspond to usage on the plateform after 2015. The current usage metrics is available 48-96 hours after online publication and is updated daily on week days.
Initial download of the metrics may take a while.