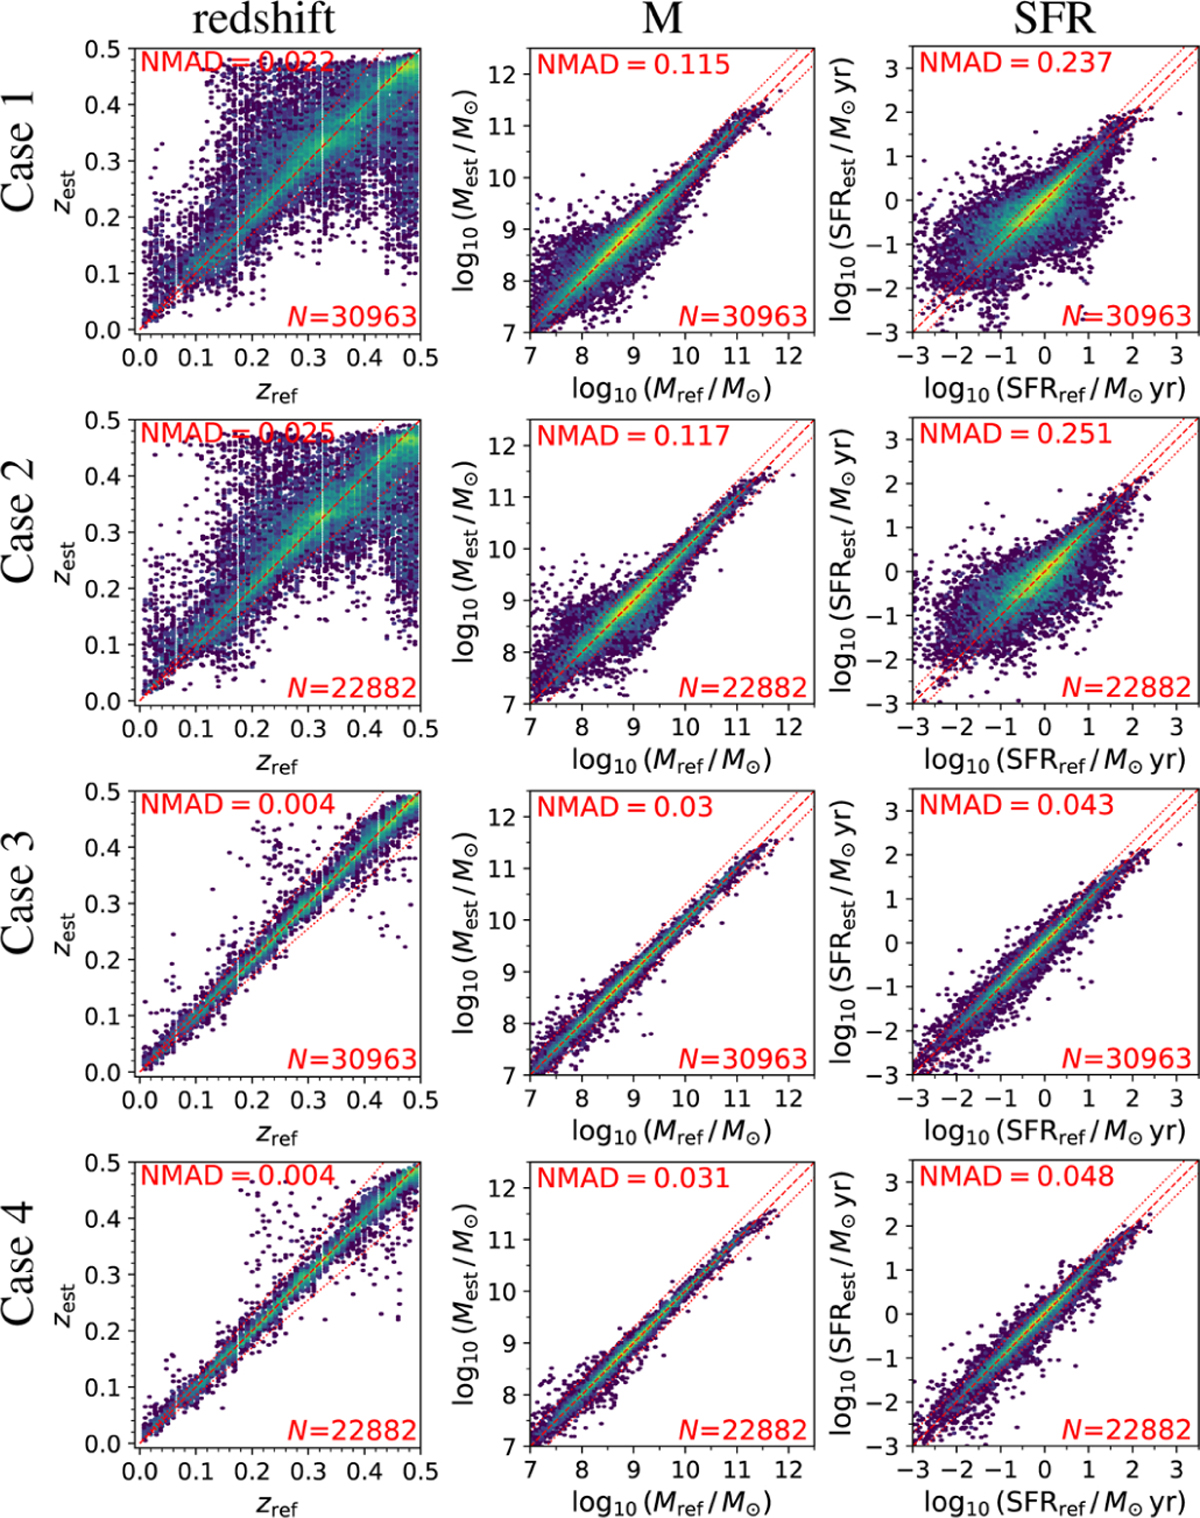
Fig. 7
Download original image
Density maps showing estimated values versus the reference values for redshift, M, and SFR for the EURISKO mock Euclid catalogue. Shown are Case 1 (first row), Case 2 (second row), Case 3 (third row), and Case 4 (fourth row). The dashed red line marks the case where the estimated value is equal to the reference value. The dotted red lines mark the area beyond which an estimated value is an outlier, using the criteria in Sect. 5.
Current usage metrics show cumulative count of Article Views (full-text article views including HTML views, PDF and ePub downloads, according to the available data) and Abstracts Views on Vision4Press platform.
Data correspond to usage on the plateform after 2015. The current usage metrics is available 48-96 hours after online publication and is updated daily on week days.
Initial download of the metrics may take a while.