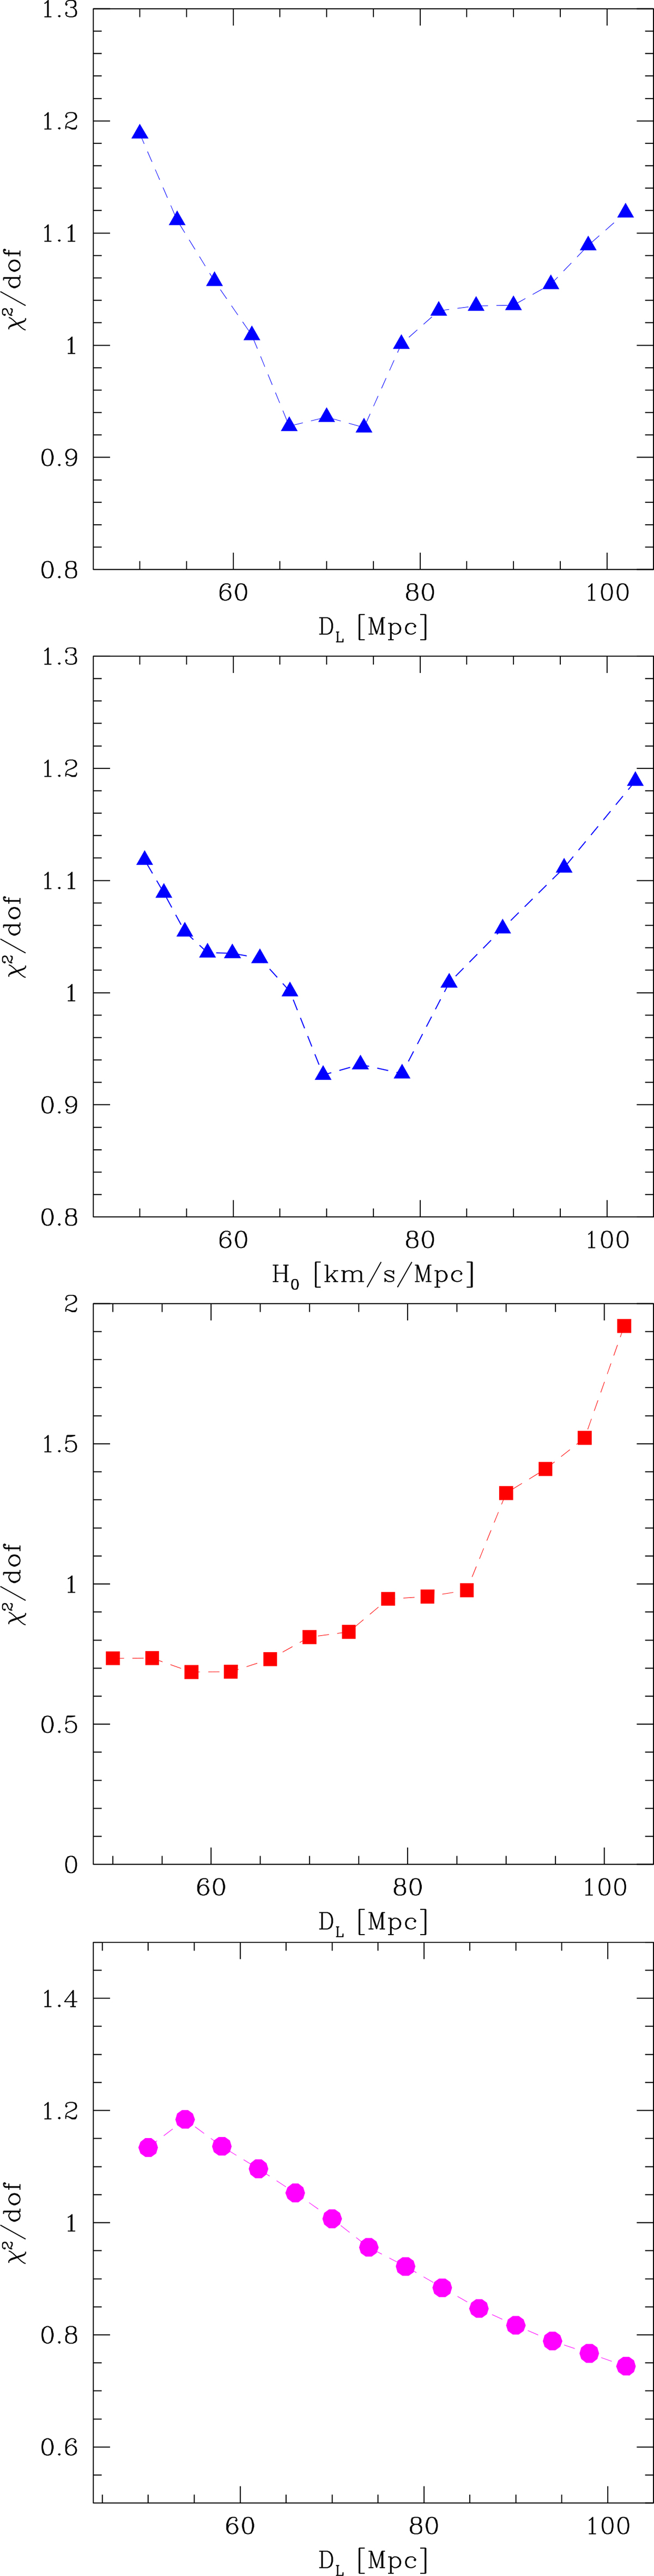
Fig. 10.
Download original image
From top to bottom: (i) Best-fit results for the simultaneous fitting of spectrum and the time delay as a function of the luminosity distance, marginalized over other model parameters; (ii) the same plot but as a function of the resulting Hubble constant; (iii) best-fit results for the spectrum alone as a function of the luminosity distance, marginalized over other parameters; and (iv) the corresponding plot for the time-delay fit alone.
Current usage metrics show cumulative count of Article Views (full-text article views including HTML views, PDF and ePub downloads, according to the available data) and Abstracts Views on Vision4Press platform.
Data correspond to usage on the plateform after 2015. The current usage metrics is available 48-96 hours after online publication and is updated daily on week days.
Initial download of the metrics may take a while.