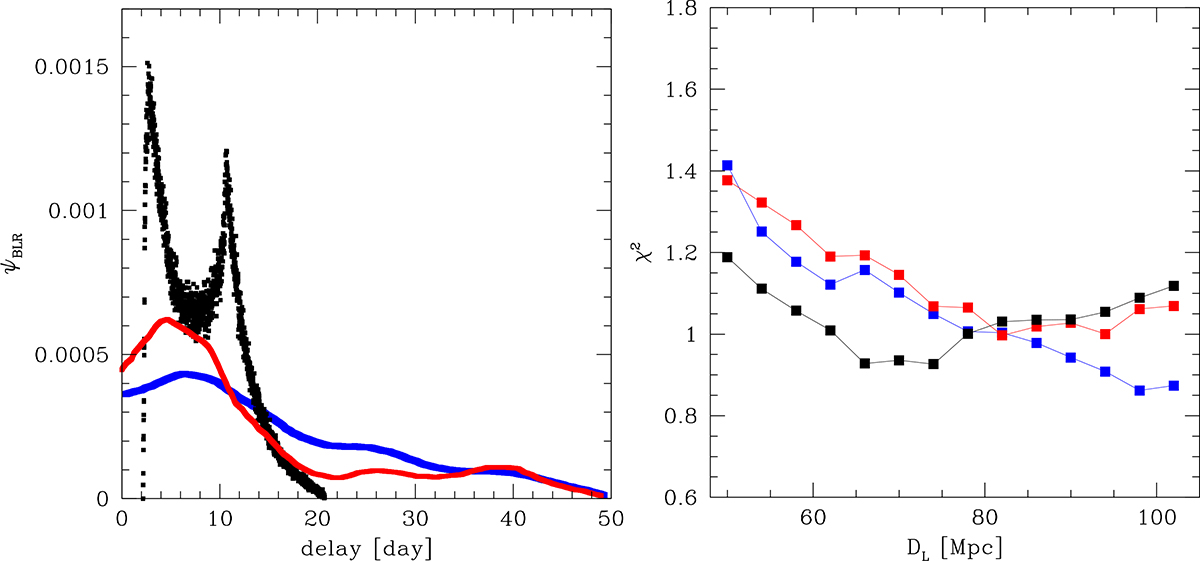
Fig. A.1.
Download original image
Upper panel: Response function from the FRADO model (black), total Hβ response (blue) presented in Figure 4 of Horne et al. (2021), and the response at 4863 Å (red) shown in Figure 9 of the same paper. Lower panel: χ2 values as a function of luminosity distance for the three response functions are shown in their respective colors.
Current usage metrics show cumulative count of Article Views (full-text article views including HTML views, PDF and ePub downloads, according to the available data) and Abstracts Views on Vision4Press platform.
Data correspond to usage on the plateform after 2015. The current usage metrics is available 48-96 hours after online publication and is updated daily on week days.
Initial download of the metrics may take a while.