Fig. 8.
Download original image
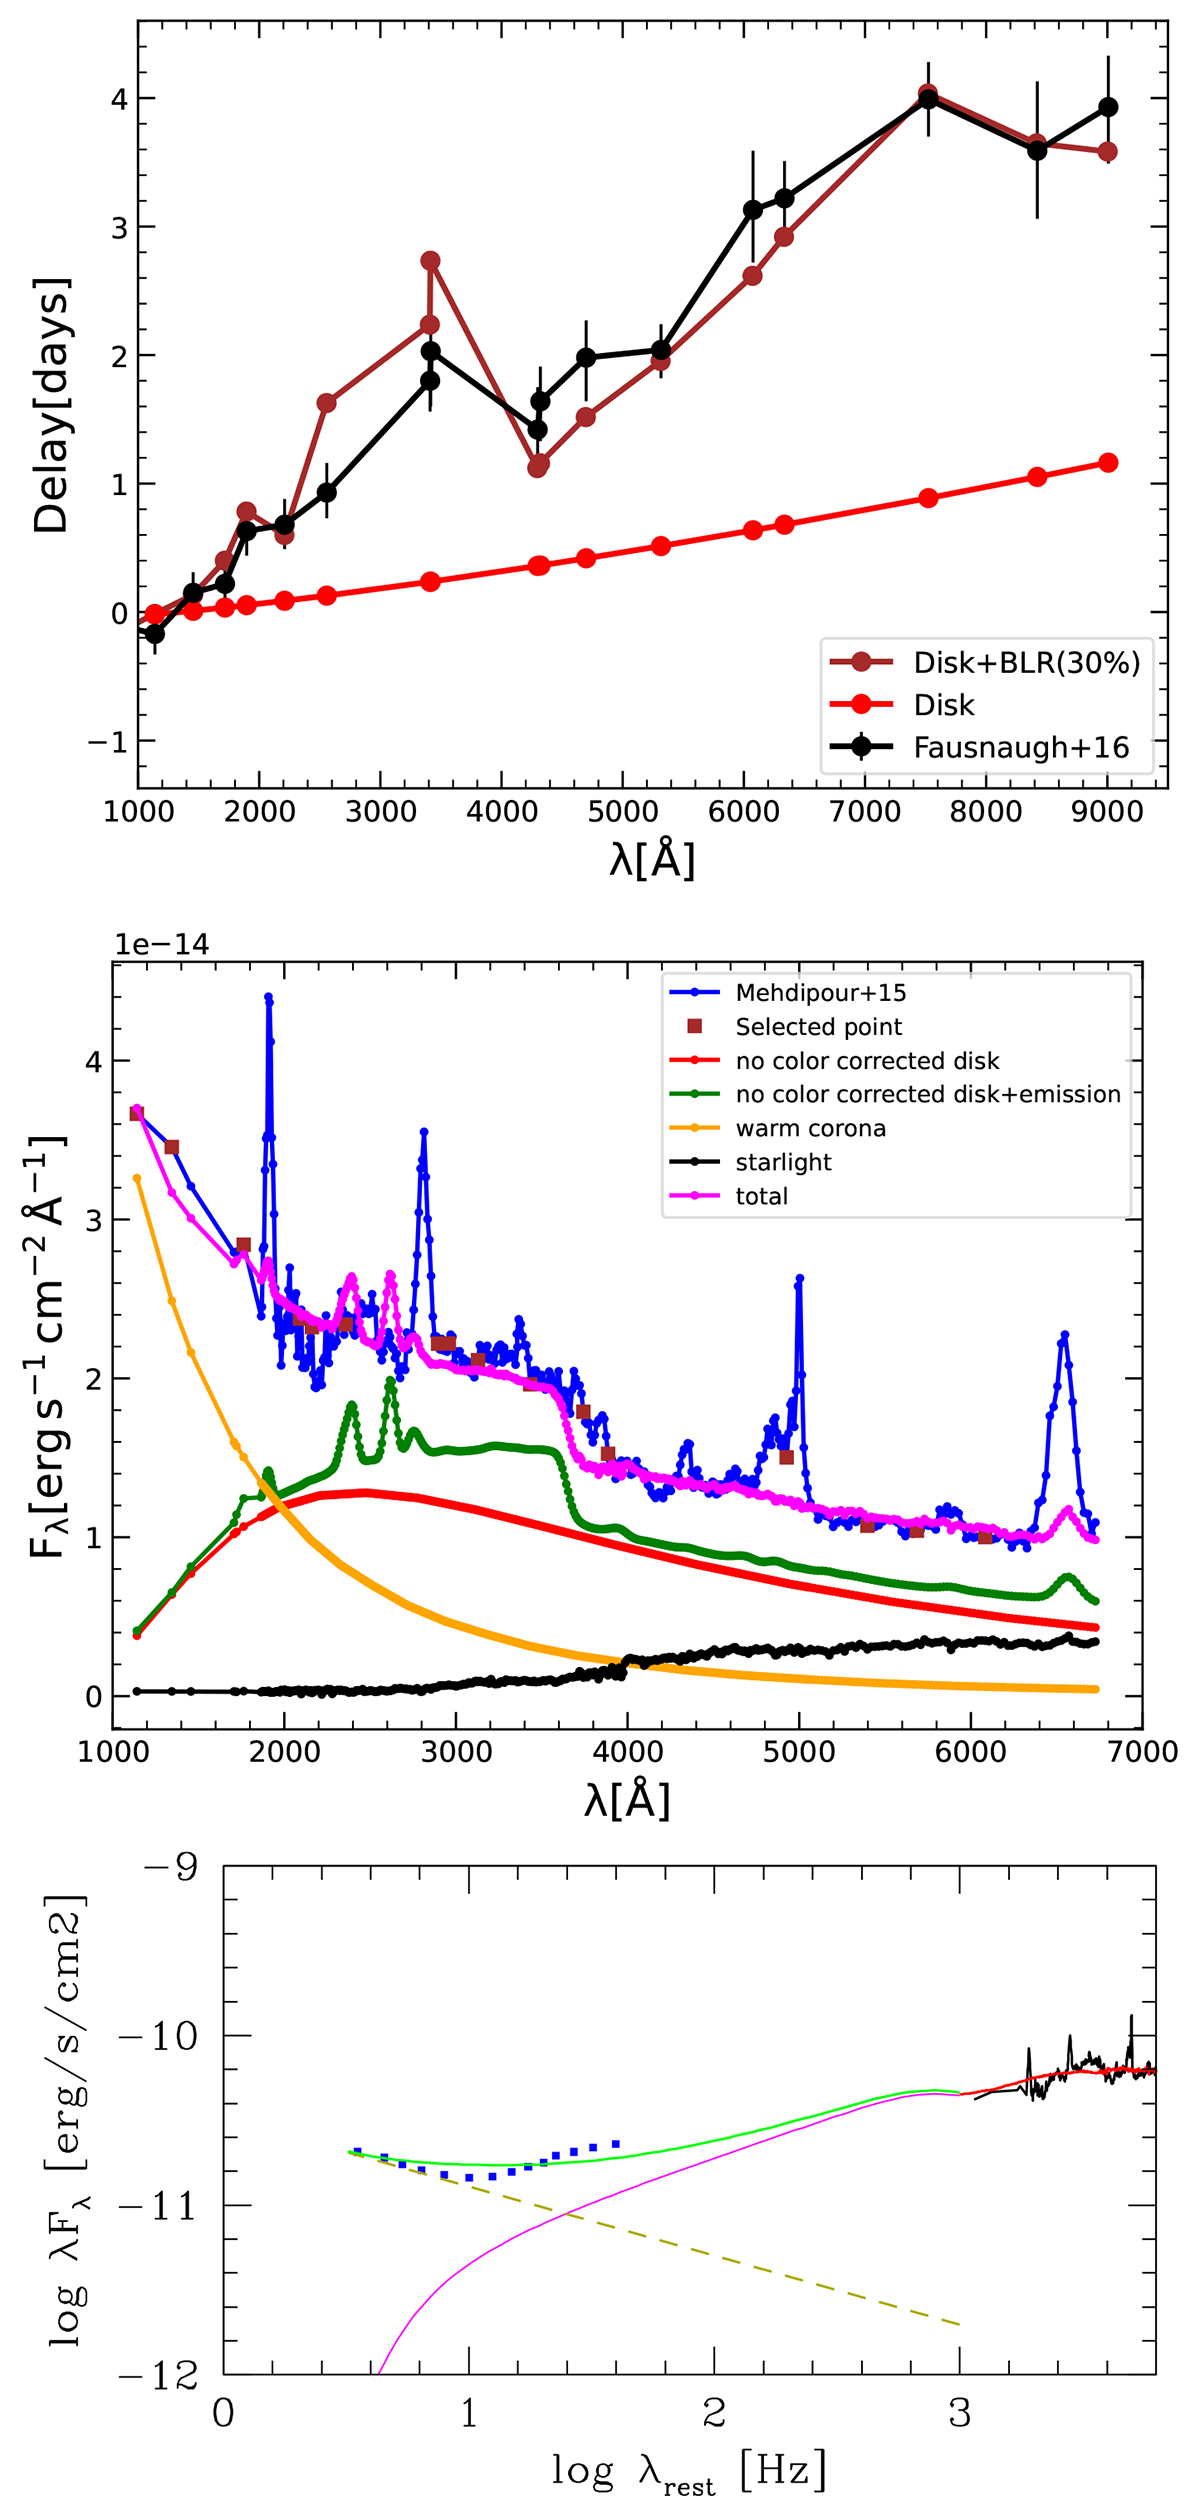
Model C. Upper panel: Observed delay from Fausnaugh et al. (2016) is represented in black. The delay calculated from the disk response function alone is shown in red, while the delay calculated from the combined response function of the disk and BLR is shown in brown. Middle panel: Observed SED from Mehdipour et al. (2015) is shown in blue. The disk SED is represented in red, while green illustrates the disk SED combined with the emission lines. The starlight contribution is represented in black, while the warm corona is shown in orange. The final SED, incorporating contributions from the disk, star, warm corona, and emission lines, is shown in purple. The selected points used for estimating the χ2 value are represented by brown squares. Parameters used: MBH = 5.0 × 10⁷ M⊙, Eddington ratio = 0.015, LX = 9.68 × 1043 erg s−1, height: h = 48.29 rg, Rin = 94.87 rg, Rout = 10 000 rg, and viewing angle: i = 40°. Bottom panel: X-ray-UV-optical SED fitting. The warm corona is represented by the magenta line, the hard X-ray power law is shown in dashed gold, the green line represents the sum of the two, and the black line displays the optical data.
Current usage metrics show cumulative count of Article Views (full-text article views including HTML views, PDF and ePub downloads, according to the available data) and Abstracts Views on Vision4Press platform.
Data correspond to usage on the plateform after 2015. The current usage metrics is available 48-96 hours after online publication and is updated daily on week days.
Initial download of the metrics may take a while.