Fig. 1.
Download original image
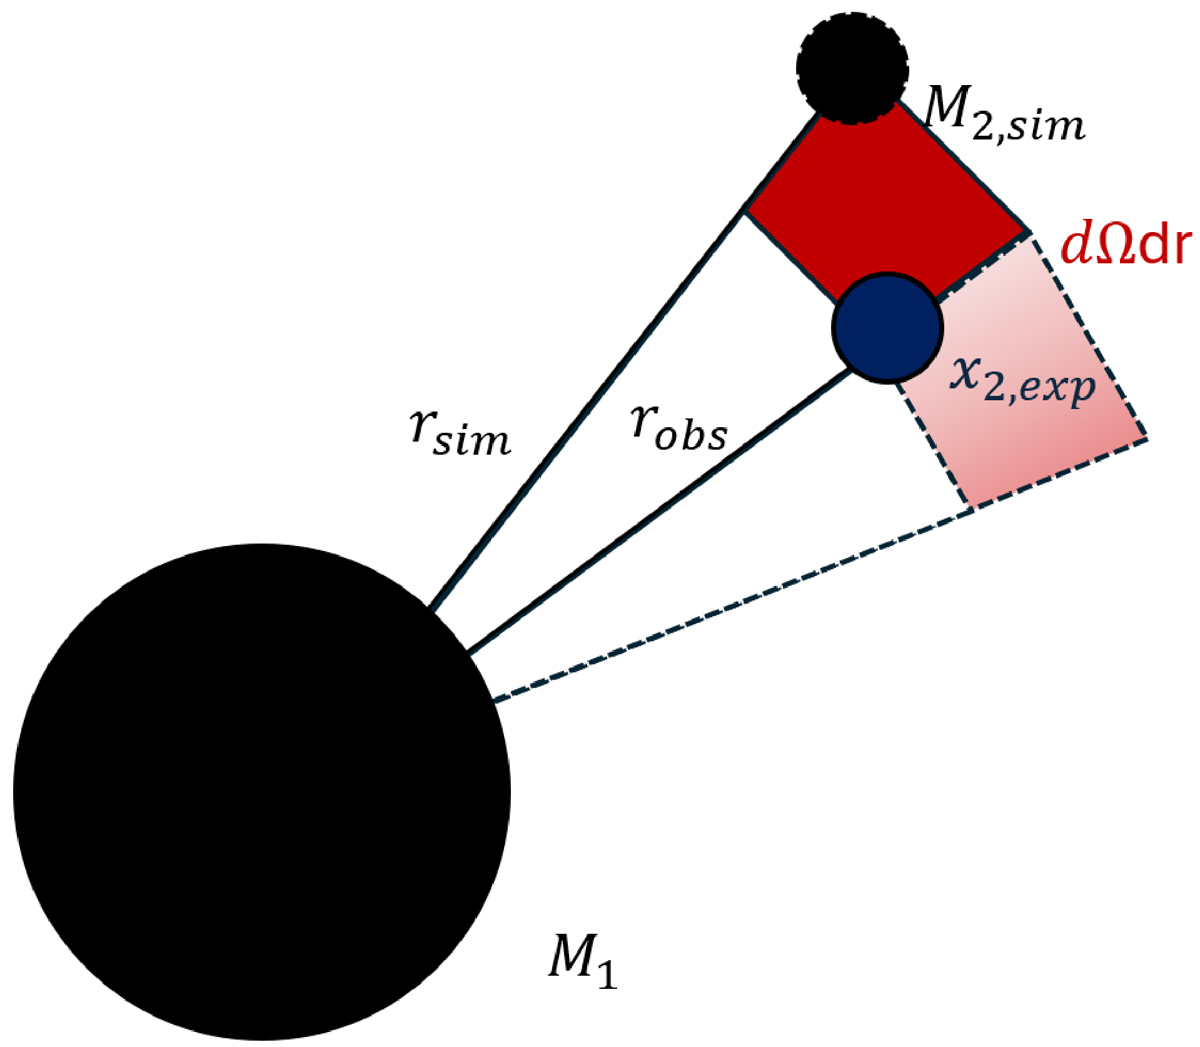
Schematic of how the two-point significances are estimated based on the radial (dr) and angular (dΩ) separation of the simulated secondary cluster, M2, to the expected position (x2, exp). The red color indicates the part of the cone that is used as a “significance volume” to compute the probability of obtaining the geometric arrangement randomly.
Current usage metrics show cumulative count of Article Views (full-text article views including HTML views, PDF and ePub downloads, according to the available data) and Abstracts Views on Vision4Press platform.
Data correspond to usage on the plateform after 2015. The current usage metrics is available 48-96 hours after online publication and is updated daily on week days.
Initial download of the metrics may take a while.