Fig. 13.
Download original image
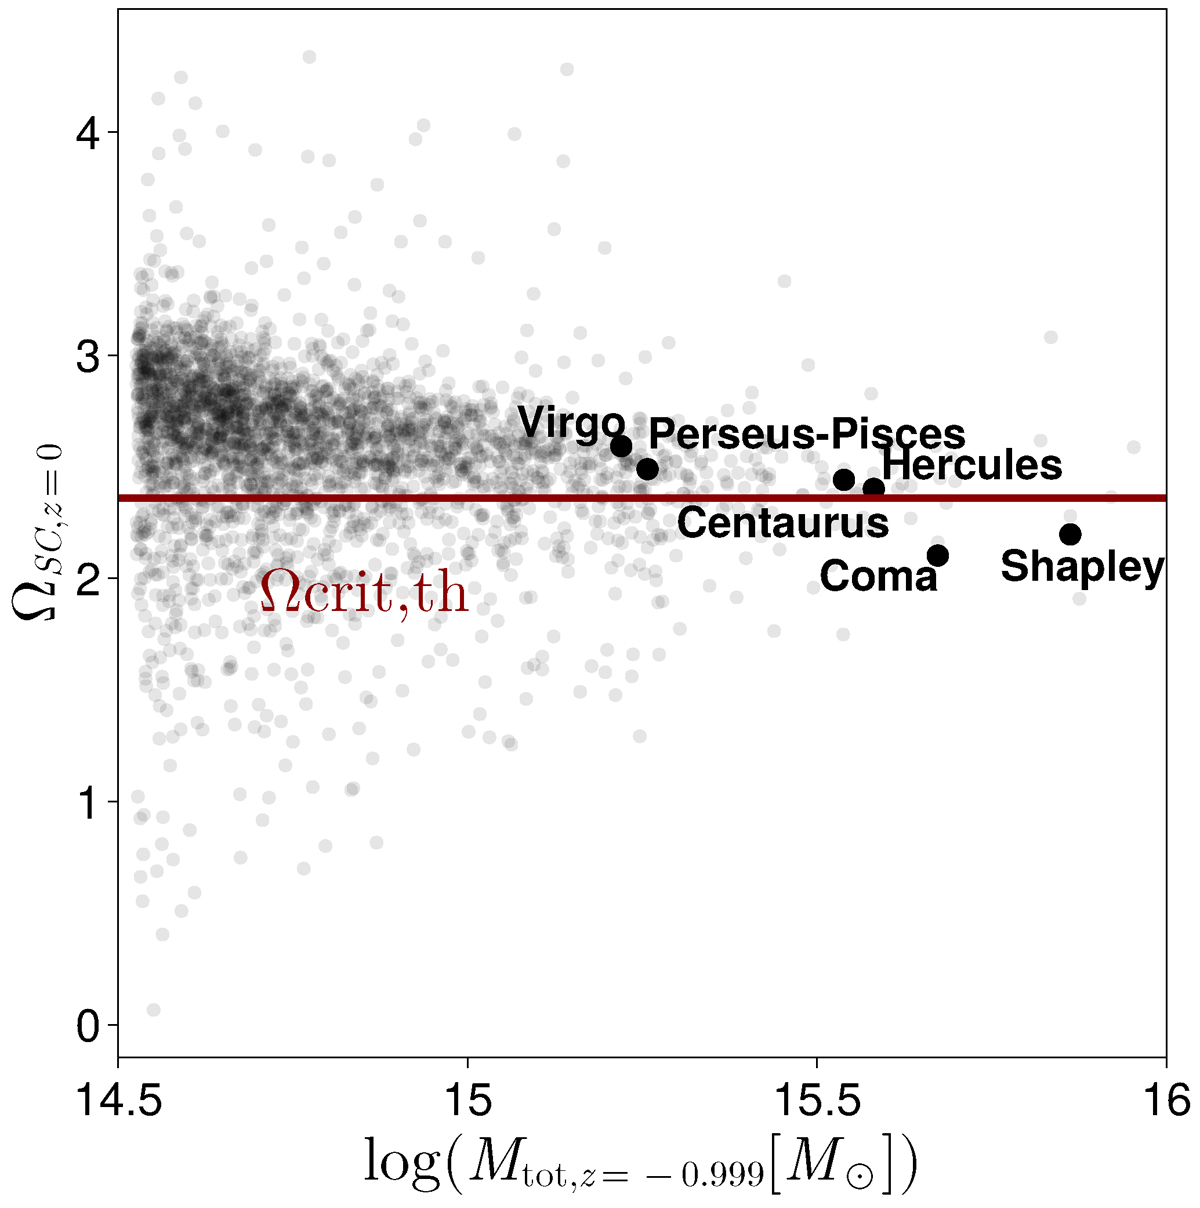
Density ratio at z = 0 of the final FOF groups of the supercluster regions identified in the Clairvoyant simulation compared to the critical collapse density contrast derived by Dünner et al. (2006) (horizontal red line). The 2000 most massive halos at z = −0.999, corresponding to the most massive superstes volumes, are shown additionally as transparent dots.
Current usage metrics show cumulative count of Article Views (full-text article views including HTML views, PDF and ePub downloads, according to the available data) and Abstracts Views on Vision4Press platform.
Data correspond to usage on the plateform after 2015. The current usage metrics is available 48-96 hours after online publication and is updated daily on week days.
Initial download of the metrics may take a while.