Fig. 2.
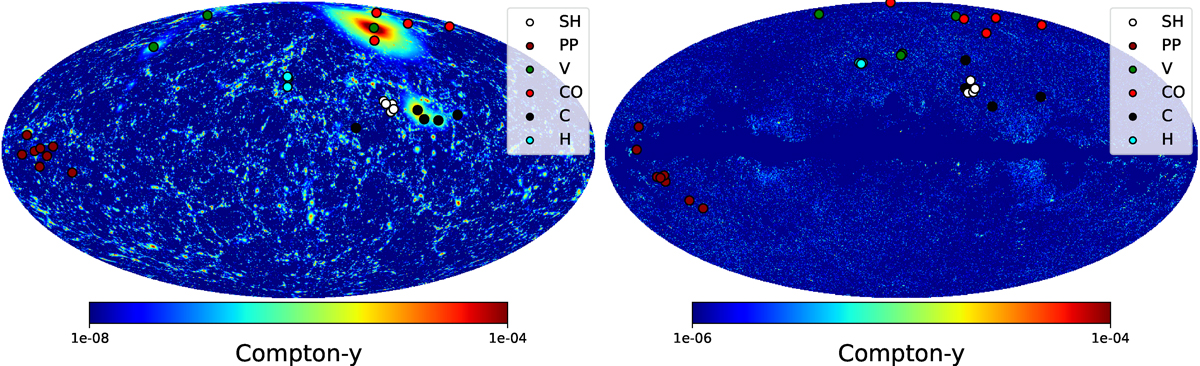
Download original image
Simulated mock Compton-y map (projection from 5−350 Mpc) from SLOW (left) and observed Compton-y map (right) from Planck (Planck Collaboration XVI 2014). Similarly to Dolag et al. (2023), the simulated map employs a larger dynamic range to highlight the imprints of the local clusters. SLOW cross-identified supercluster members compared to selected observationally obtained supercluster regions using the catalogs from Böhringer & Chon (2021), Böhringer et al. (2021b), Proust et al. (2006), Monteiro-Oliveira et al. (2022). The different colors indicate the regions: C = Centaurus, CO = Coma, H = Hercules, PP = Perseus-Pisces, SH = Shapley, and V = Virgo (Local supercluster).
Current usage metrics show cumulative count of Article Views (full-text article views including HTML views, PDF and ePub downloads, according to the available data) and Abstracts Views on Vision4Press platform.
Data correspond to usage on the plateform after 2015. The current usage metrics is available 48-96 hours after online publication and is updated daily on week days.
Initial download of the metrics may take a while.