Fig. 4.
Download original image
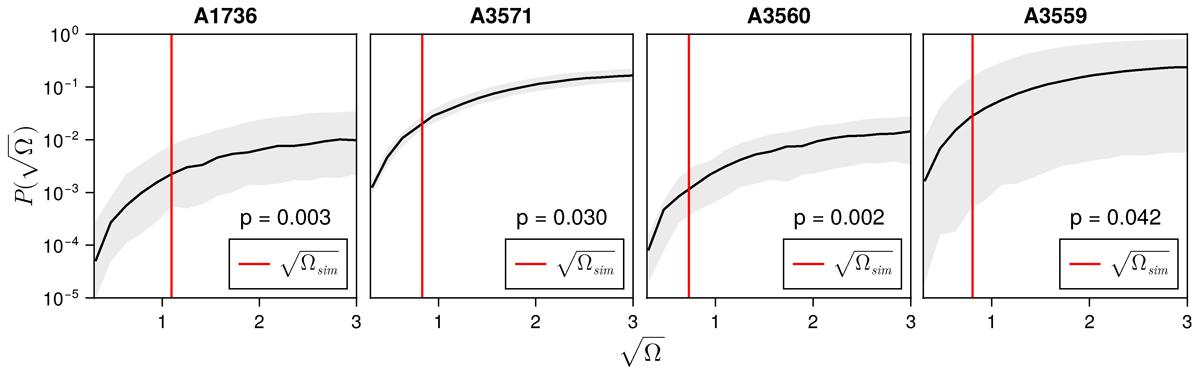
Two-point probabilities for the Shapley member clusters as a function of the opening angle ![]() of the cone spanned by the observed and simulated relative position of the secondary cluster to the main. The shaded gray regions reflect the mass uncertainty of the secondary halo. The vertical red line indicates the deviation angle measured in the SLOW simulation. The x value of the intersect of this line with the angular probability function gives the probability of finding the secondary within the deviation cone in a random simulation.
of the cone spanned by the observed and simulated relative position of the secondary cluster to the main. The shaded gray regions reflect the mass uncertainty of the secondary halo. The vertical red line indicates the deviation angle measured in the SLOW simulation. The x value of the intersect of this line with the angular probability function gives the probability of finding the secondary within the deviation cone in a random simulation.
Current usage metrics show cumulative count of Article Views (full-text article views including HTML views, PDF and ePub downloads, according to the available data) and Abstracts Views on Vision4Press platform.
Data correspond to usage on the plateform after 2015. The current usage metrics is available 48-96 hours after online publication and is updated daily on week days.
Initial download of the metrics may take a while.