Fig. 5.
Download original image
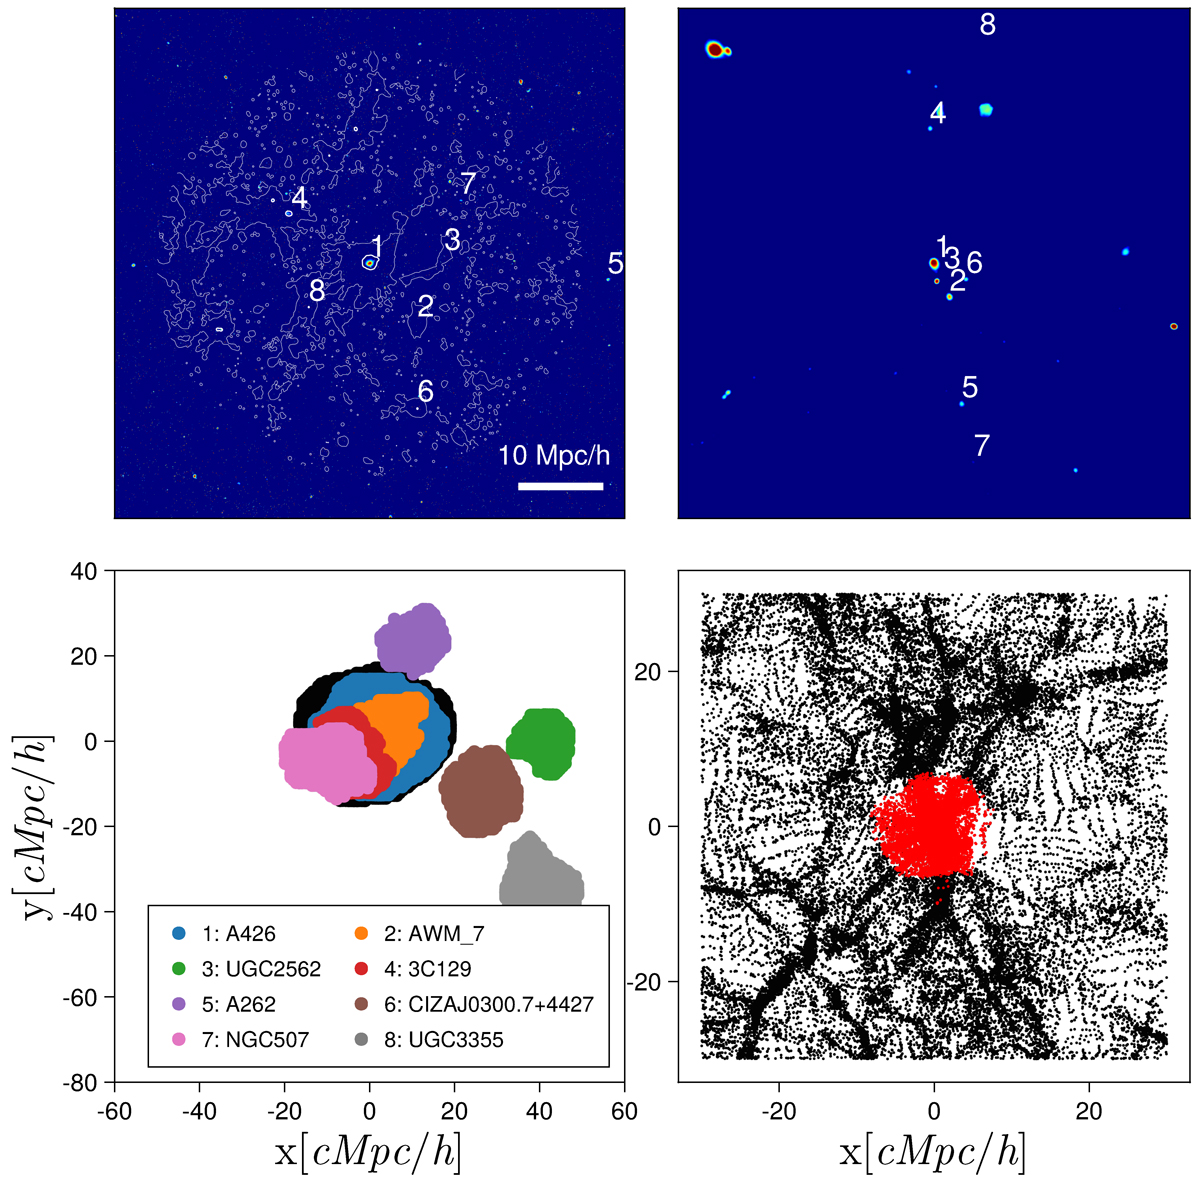
Perseus-Pisces supercluster region in the SLOW simulation with the cross-identified counterparts: 1: Perseus (A426), 2: AWM 7, 3: UGC2562, 4: 3C129, 5: A262, 6: CIZAJ0300.7+4427, 7: NGC507, 8: UGC3355. The white contours show the 2D gas overdensity levels of ![]() . The gas density was computed in a spherical shell of 54 Mpc/h thickness centered on the main cluster. Top right: Same region as viewed by ROSAT. Bottom left: Supercluster core region according to the Clairvoyant N-Body forward simulation in the initial conditions (z = 120). Bottom right: Collapse region (red) and its environment at z = 0.
. The gas density was computed in a spherical shell of 54 Mpc/h thickness centered on the main cluster. Top right: Same region as viewed by ROSAT. Bottom left: Supercluster core region according to the Clairvoyant N-Body forward simulation in the initial conditions (z = 120). Bottom right: Collapse region (red) and its environment at z = 0.
Current usage metrics show cumulative count of Article Views (full-text article views including HTML views, PDF and ePub downloads, according to the available data) and Abstracts Views on Vision4Press platform.
Data correspond to usage on the plateform after 2015. The current usage metrics is available 48-96 hours after online publication and is updated daily on week days.
Initial download of the metrics may take a while.