Fig. 2.
Download original image
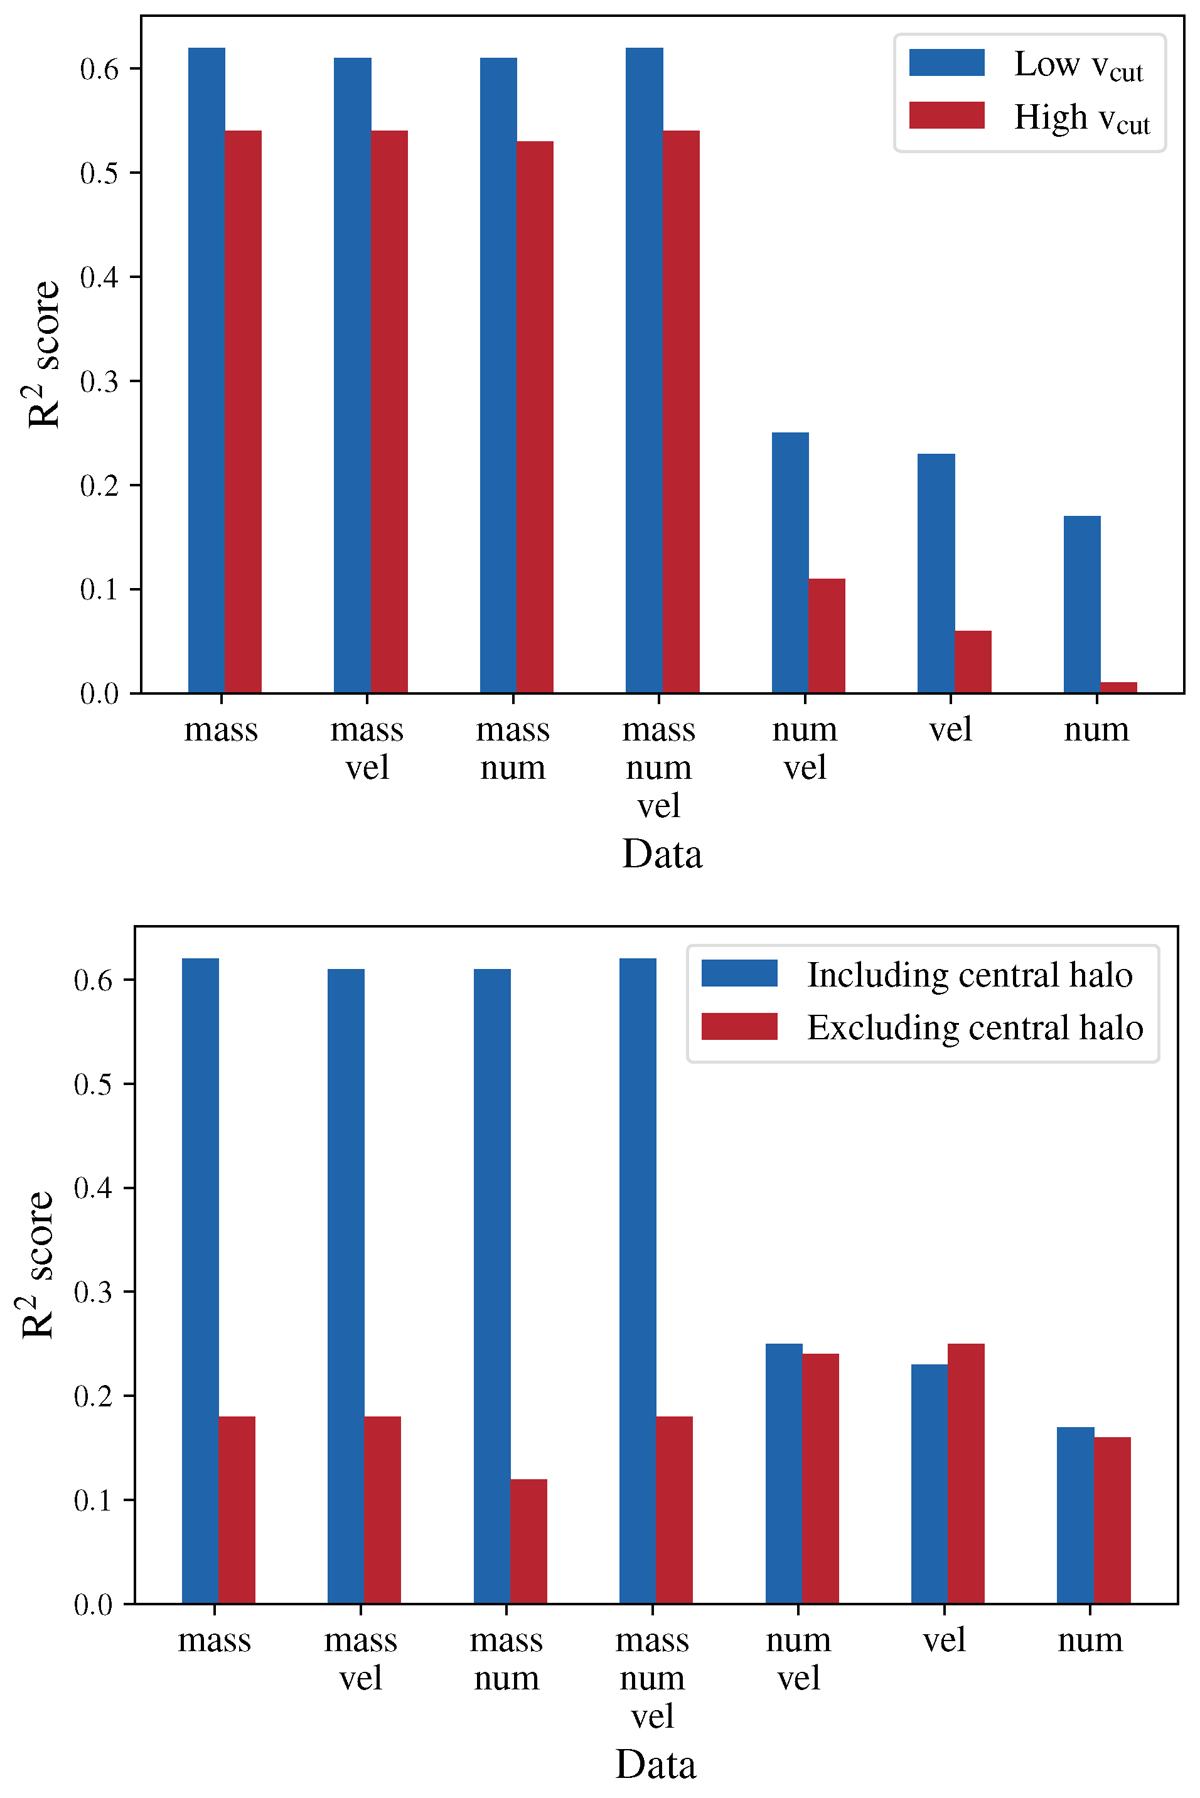
Performance comparison across different models. Upper panel: Comparison between low- and high-velocity-cut models’ performance. The plot shows different R2 values for each combination of the three features considered: mass column density, number column density, and mean line-of-sight velocity (indicated as “mass”, “num”, and “vel” respectively). Best results are obtained for the low velocity cut (due to less contamination) and for data containing the mass. Lower panel: Comparison between models including or excluding the central halo. Both analyses are performed for the low-velocity-cut data. Without the central halo, performance drops significantly across models; all models without it predict the turnaround with a similar score.
Current usage metrics show cumulative count of Article Views (full-text article views including HTML views, PDF and ePub downloads, according to the available data) and Abstracts Views on Vision4Press platform.
Data correspond to usage on the plateform after 2015. The current usage metrics is available 48-96 hours after online publication and is updated daily on week days.
Initial download of the metrics may take a while.