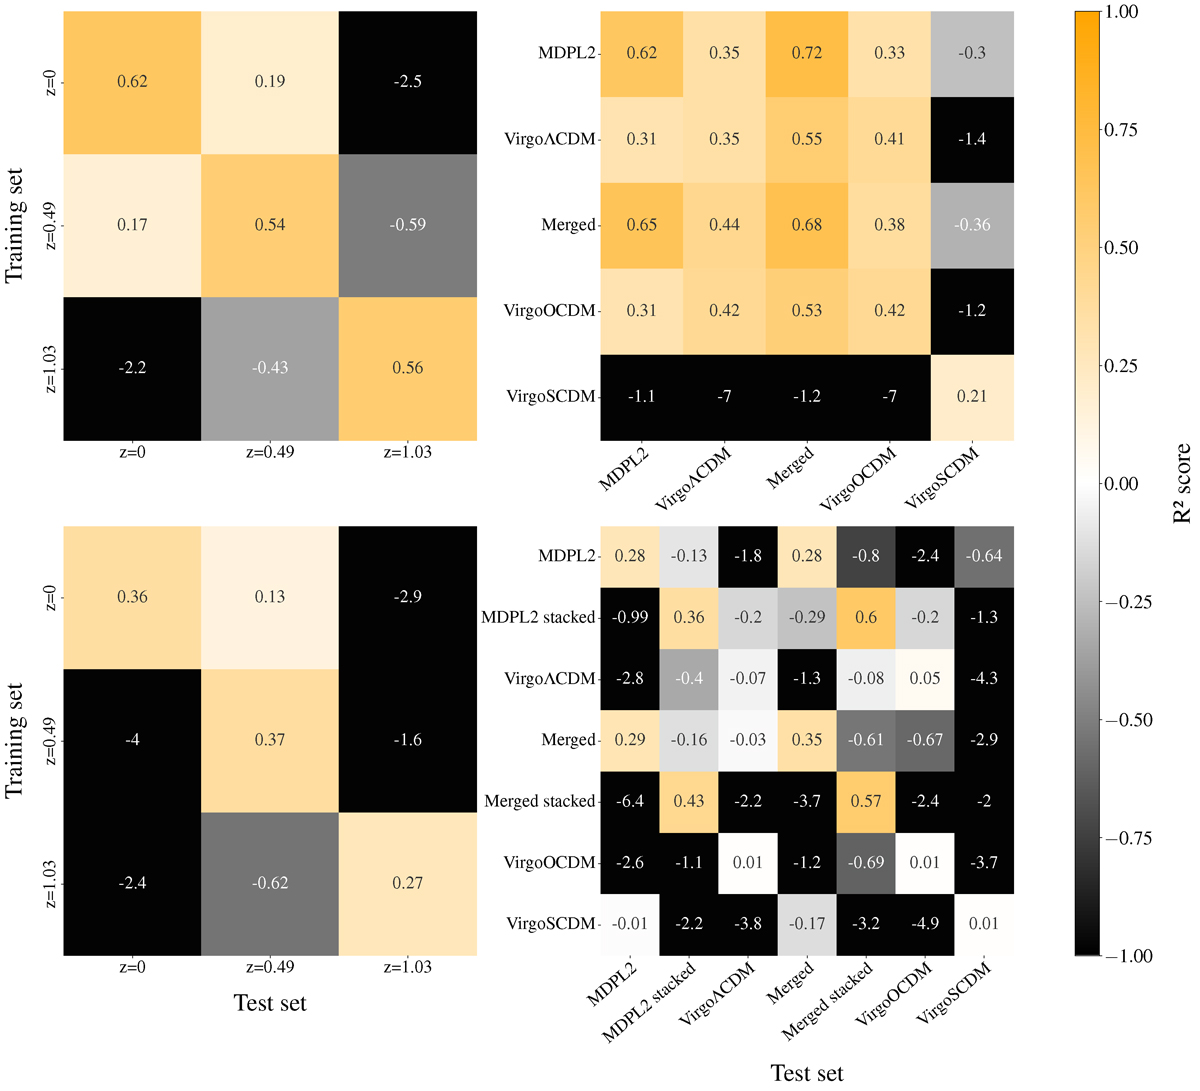
Fig. 4.
Download original image
R2 scores of different combinations of training and testing data using the mass column density (upper panel) or velocity dispersion (lower panel) information. 80% of the simulation data were used for training-validation, and 20% was used for the testing in each case located in the diagonal. Left panel: Training and testing data from different MDPL2 redshifts (z = 0, 0.49, 1.03). As expected, for each training set, the R2 score is the highest when evaluated on data from the same redshift. Since MDPL2 is a ΛCDM concordance cosmological simulation, the ρta depends on redshift. Therefore, for different redshifts, the model cannot find an apparent correlation between Mvir and Rta because ρta varies with redshift. The velocity information plot has the same form as the mass, indicating that the model just correlates the mass with the velocity dispersion. Right panel: Training and testing data from different simulations and cosmological models (MDPL2, Virgo ΛCDM, Virgo OCDM, Virgo SCDM, and the merged data from MDPL2 and Virgo ΛCDM). Best models seem to be the ones containing the data from the MDPL2, possibly due to the fact of the larger number of training instances. Negative R2 values are a direct consequence of the fact that evaluating a model on another simulation can predict values even worse than the mean (as discussed in Sect. 3), since the target value distribution is an unknown.
Current usage metrics show cumulative count of Article Views (full-text article views including HTML views, PDF and ePub downloads, according to the available data) and Abstracts Views on Vision4Press platform.
Data correspond to usage on the plateform after 2015. The current usage metrics is available 48-96 hours after online publication and is updated daily on week days.
Initial download of the metrics may take a while.