Fig. 6.
Download original image
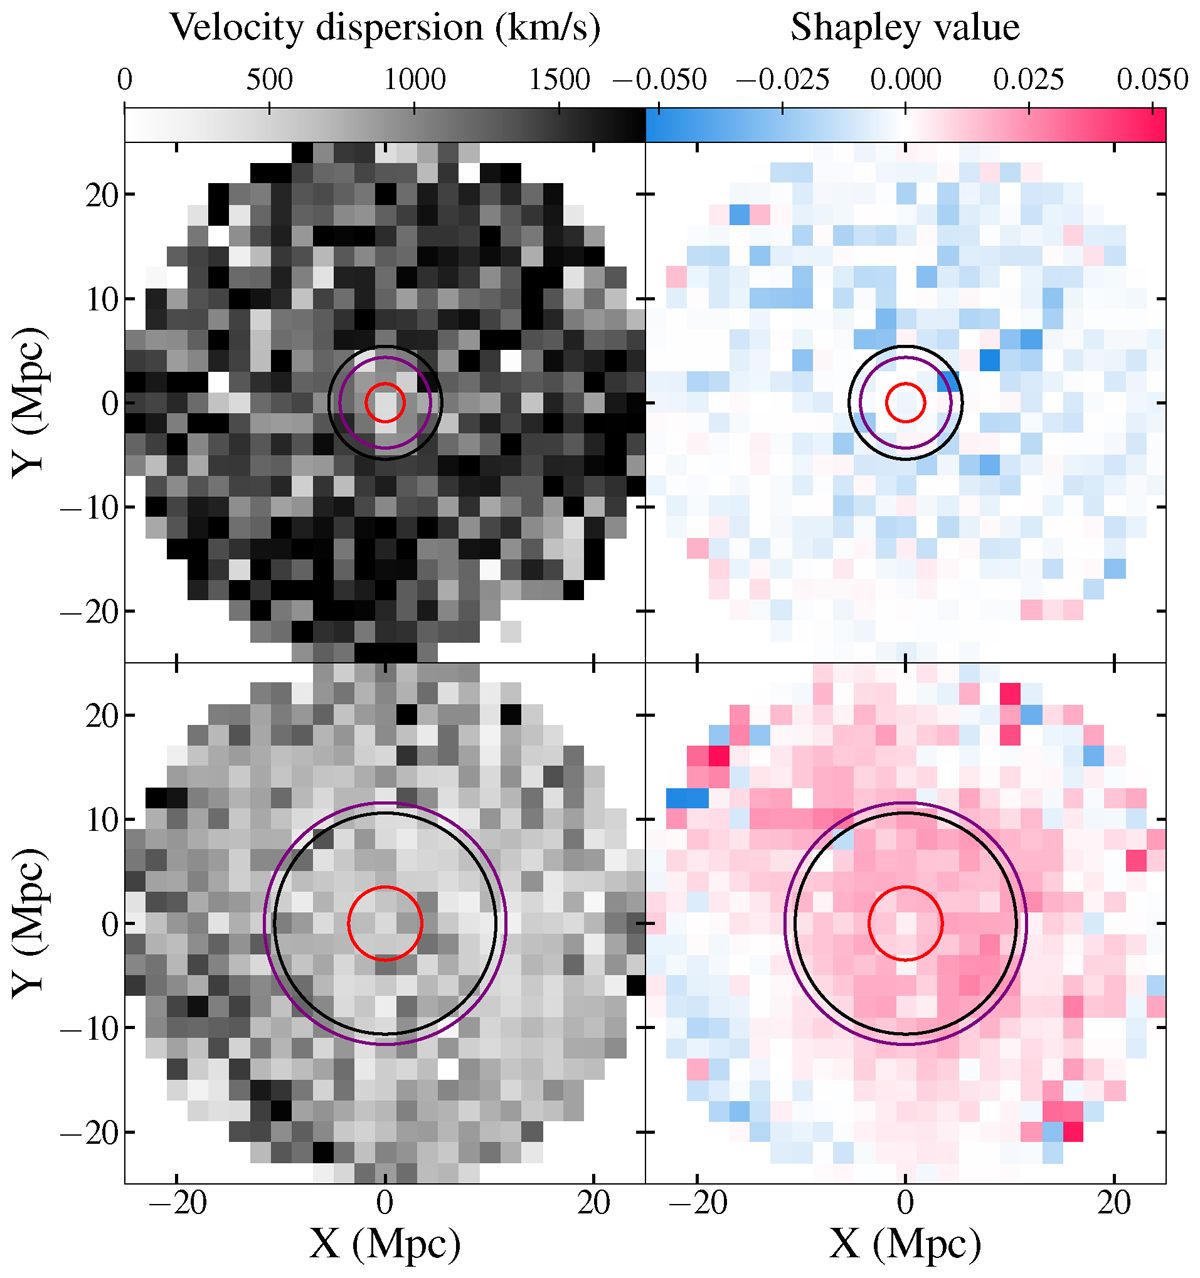
Shapley values of two random test projections (upper and lower panel) from the merged and stacked MDPL2 and Virgo ΛCDM data. Left panel: Standard deviation of the halo velocity in each pixel. Right panel: Shapley values in each pixel (pink: higher prediction; blue: lower prediction). The red circle represents the R200, while the black and purple circles represent the true and the predicted Rta, respectively. Lower dispersion is always prominent in the central area due to the virialization of the matter surrounding the central perturbation. However, the extent of this lower dispersion area seems to indicate to the model where the turnaround radius should be. In particular, in the first image, the structure seems to have higher dispersion in areas far from the center, compared to the second one, which has lower values. The high dispersion seems to indicate to the model that the turnaround radius should be lower, while the lower dispersion indicates the opposite.
Current usage metrics show cumulative count of Article Views (full-text article views including HTML views, PDF and ePub downloads, according to the available data) and Abstracts Views on Vision4Press platform.
Data correspond to usage on the plateform after 2015. The current usage metrics is available 48-96 hours after online publication and is updated daily on week days.
Initial download of the metrics may take a while.