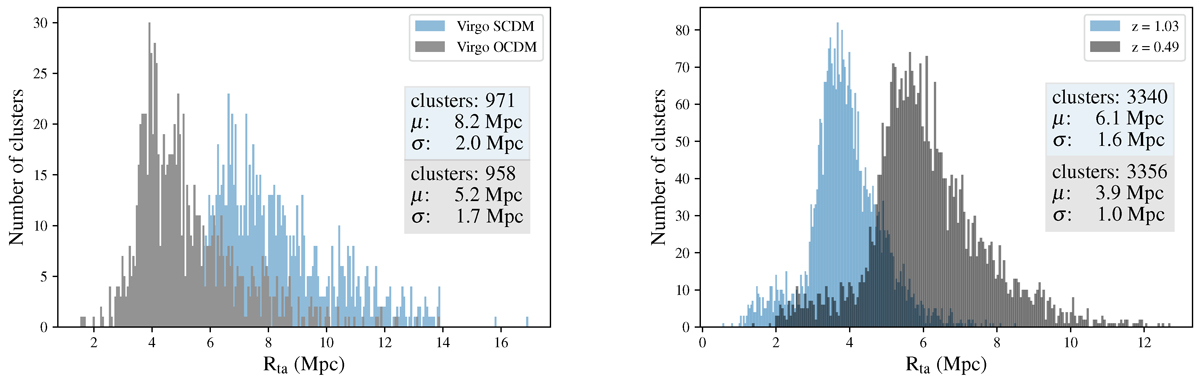
Fig. A.1.
Download original image
Histogram of Rta values from MDPL2 form z = 0.49 and z = 1.03 (left panel) and Virgo from OCDM and ΛCDM cosmology (right panel), similarly to Fig.1. The distribution moves as we change the redshift or Ωm and ΩΛ, which is expected due to the dependence of ρta on the cosmological setting discussed throughout the paper and proved in Pavlidou et al. (2020).
Current usage metrics show cumulative count of Article Views (full-text article views including HTML views, PDF and ePub downloads, according to the available data) and Abstracts Views on Vision4Press platform.
Data correspond to usage on the plateform after 2015. The current usage metrics is available 48-96 hours after online publication and is updated daily on week days.
Initial download of the metrics may take a while.