Fig. C.1.
Download original image
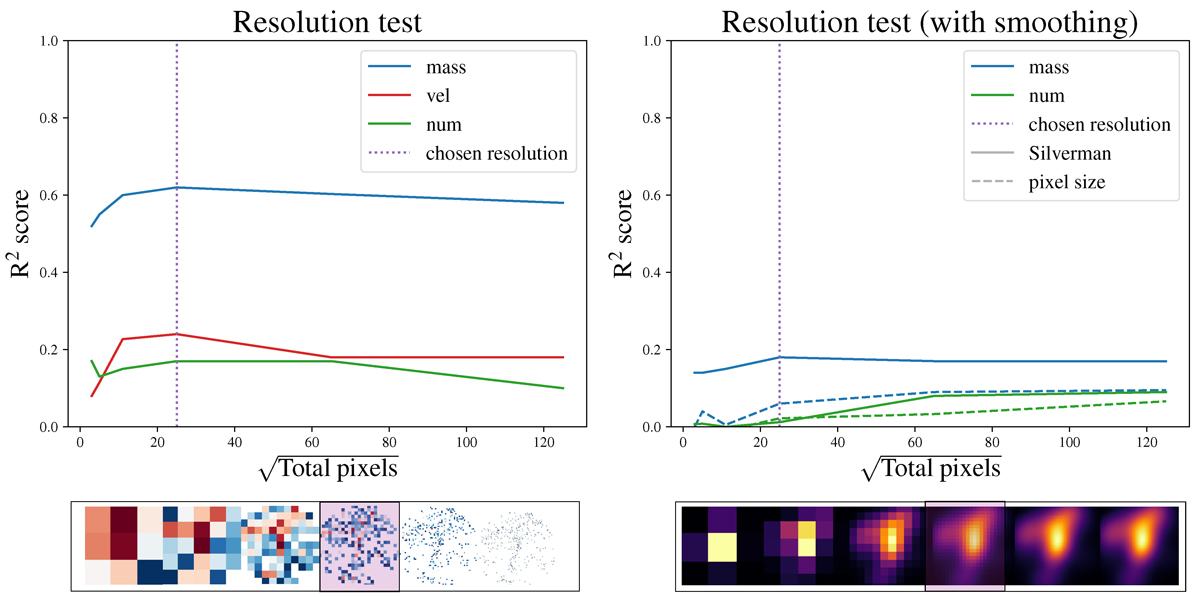
Resolution sensitivity test results for the base CNN model and its variations. Left panel: R2 scores of the best-performing model for each tested resolution (![]() ), with example “mass” images shown below. Right panel: Same test applied to images smoothed with a Gaussian kernel density estimate, using either Silverman’s rule of thumb (Silverman 1986) or a bandwidth equal to the pixel size. Example “mass” images for the former are shown below. The chosen resolution (dotted purple line and shaded purple region) provides an optimal balance between predictive accuracy and numerical stability.
), with example “mass” images shown below. Right panel: Same test applied to images smoothed with a Gaussian kernel density estimate, using either Silverman’s rule of thumb (Silverman 1986) or a bandwidth equal to the pixel size. Example “mass” images for the former are shown below. The chosen resolution (dotted purple line and shaded purple region) provides an optimal balance between predictive accuracy and numerical stability.
Current usage metrics show cumulative count of Article Views (full-text article views including HTML views, PDF and ePub downloads, according to the available data) and Abstracts Views on Vision4Press platform.
Data correspond to usage on the plateform after 2015. The current usage metrics is available 48-96 hours after online publication and is updated daily on week days.
Initial download of the metrics may take a while.