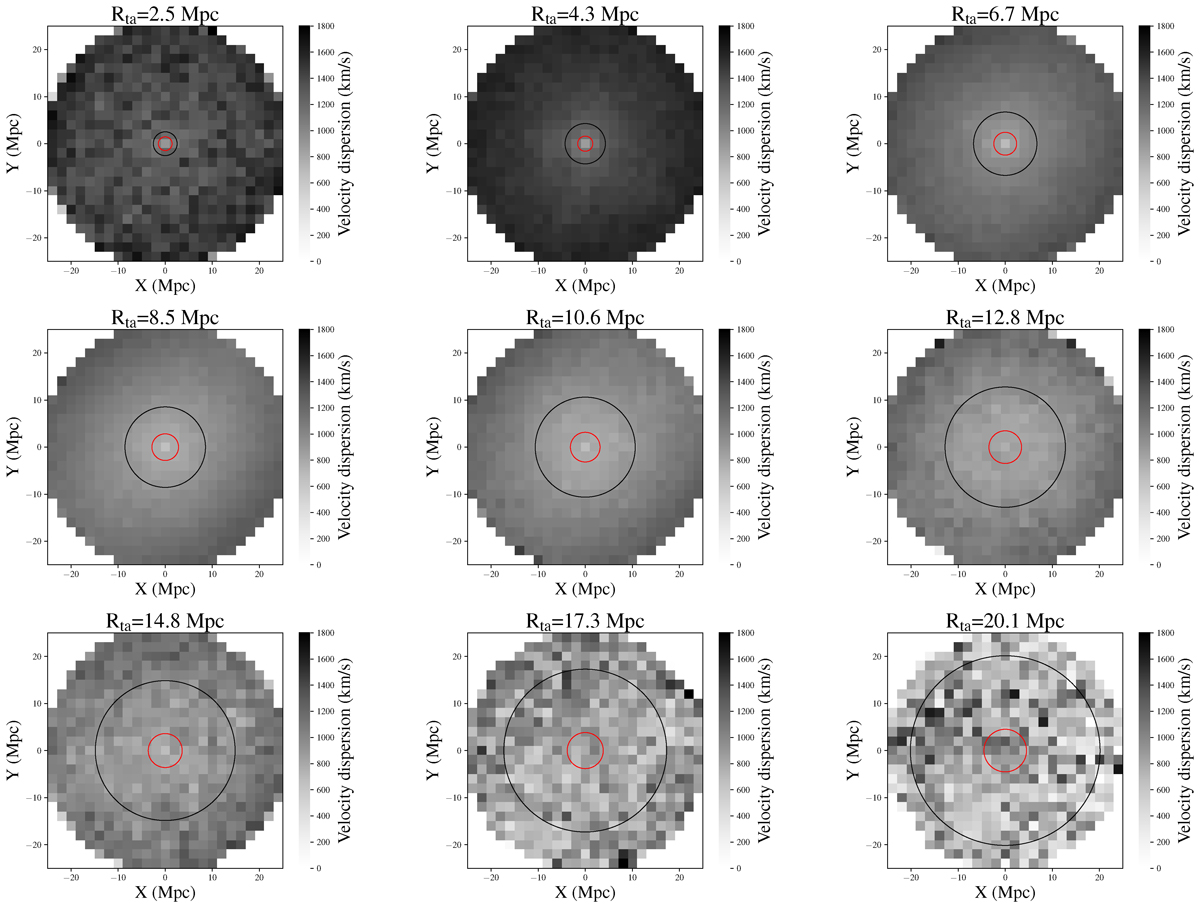
Fig. D.1.
Download original image
Stacked velocity dispersion images of the merged MDPL2 and Virgo ΛCDM data. The turnaround values of the dataset were segmented into nine bins. All of the corresponding clusters’ projections of line-of-sight velocities, which belong in the same bin category, were stacked on top of each other to create nine images, calculating the standard deviation in each pixel. On top of each image is the mean value of the turnaround radii in each bin, which is represented with a black circle in each image. Red circles represent the mean R200 in each case. There is no apparent way of predicting the Rta based on these images “by eye,” especially outside of the Rta range 4.3 − 10.6 Mpc.
Current usage metrics show cumulative count of Article Views (full-text article views including HTML views, PDF and ePub downloads, according to the available data) and Abstracts Views on Vision4Press platform.
Data correspond to usage on the plateform after 2015. The current usage metrics is available 48-96 hours after online publication and is updated daily on week days.
Initial download of the metrics may take a while.