Fig. C.1
Download original image
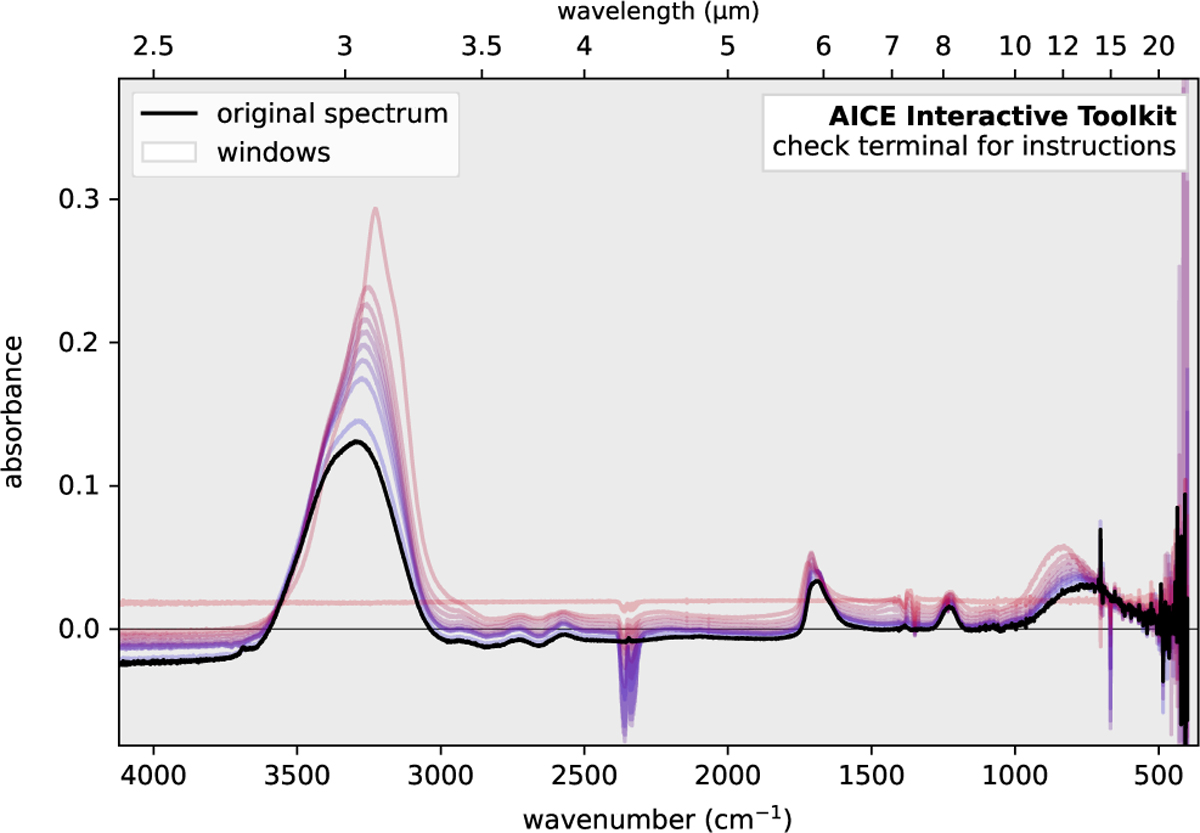
Spectra obtained in the experiment #12 of LIDA, from a mixture of H2O: HCOOH (91:9), as seen with our AICE Interactive Toolkit. The curve in black is the spectrum at 15 K, and the rest of coloured curves correspond to spectra with increasing temperature, with a step of 15 K until 165 K (which is almost flat, as both species have desorbed). The spectra were originally published by Bisschop et al. (2007).
Current usage metrics show cumulative count of Article Views (full-text article views including HTML views, PDF and ePub downloads, according to the available data) and Abstracts Views on Vision4Press platform.
Data correspond to usage on the plateform after 2015. The current usage metrics is available 48-96 hours after online publication and is updated daily on week days.
Initial download of the metrics may take a while.