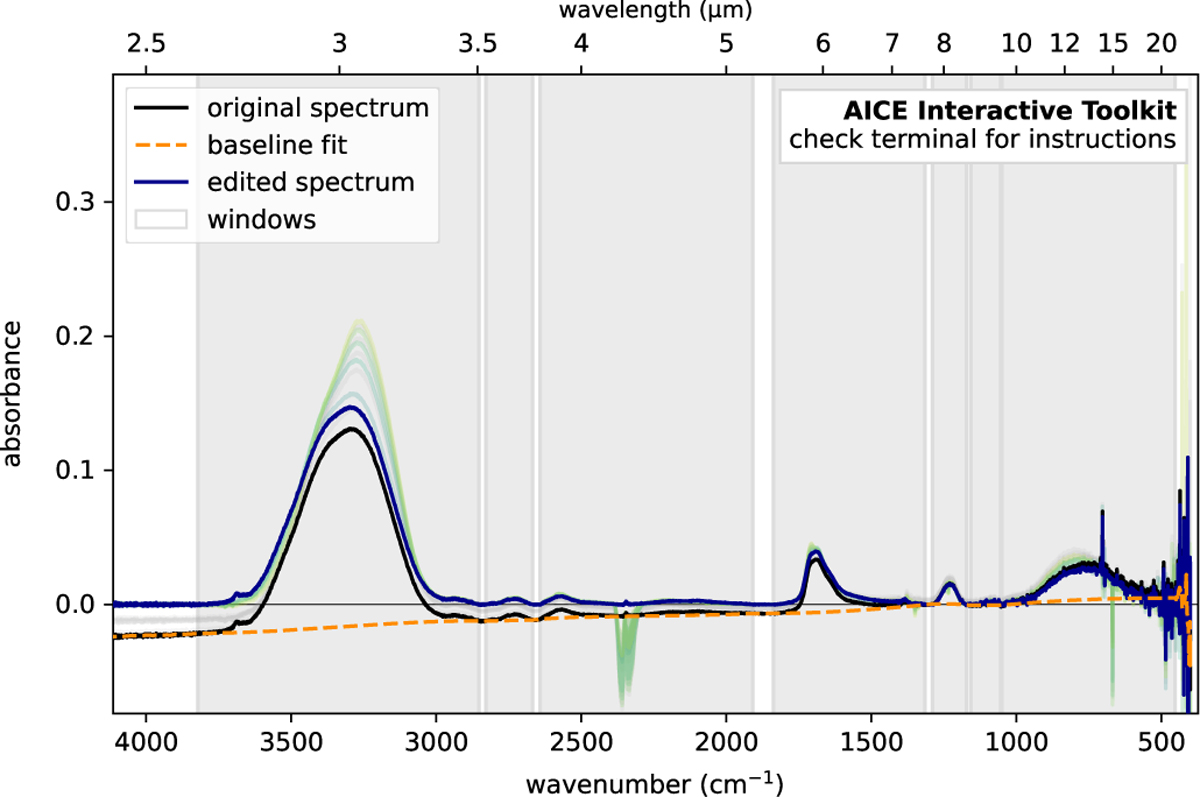
Fig. C.2
Download original image
Same as Fig. C.1, after removal of the spectra with temperatures greater than 100 K and after baseline subtraction. Now the curve in orange shows the fitted baseline (in the white spectral windows) for the spectrum at 15 K (black curve), and the blue curve shows the corresponding reduced spectrum. The rest of coloured curves are the reduced spectra for the rest of temperatures.
Current usage metrics show cumulative count of Article Views (full-text article views including HTML views, PDF and ePub downloads, according to the available data) and Abstracts Views on Vision4Press platform.
Data correspond to usage on the plateform after 2015. The current usage metrics is available 48-96 hours after online publication and is updated daily on week days.
Initial download of the metrics may take a while.