Fig. D.1
Download original image
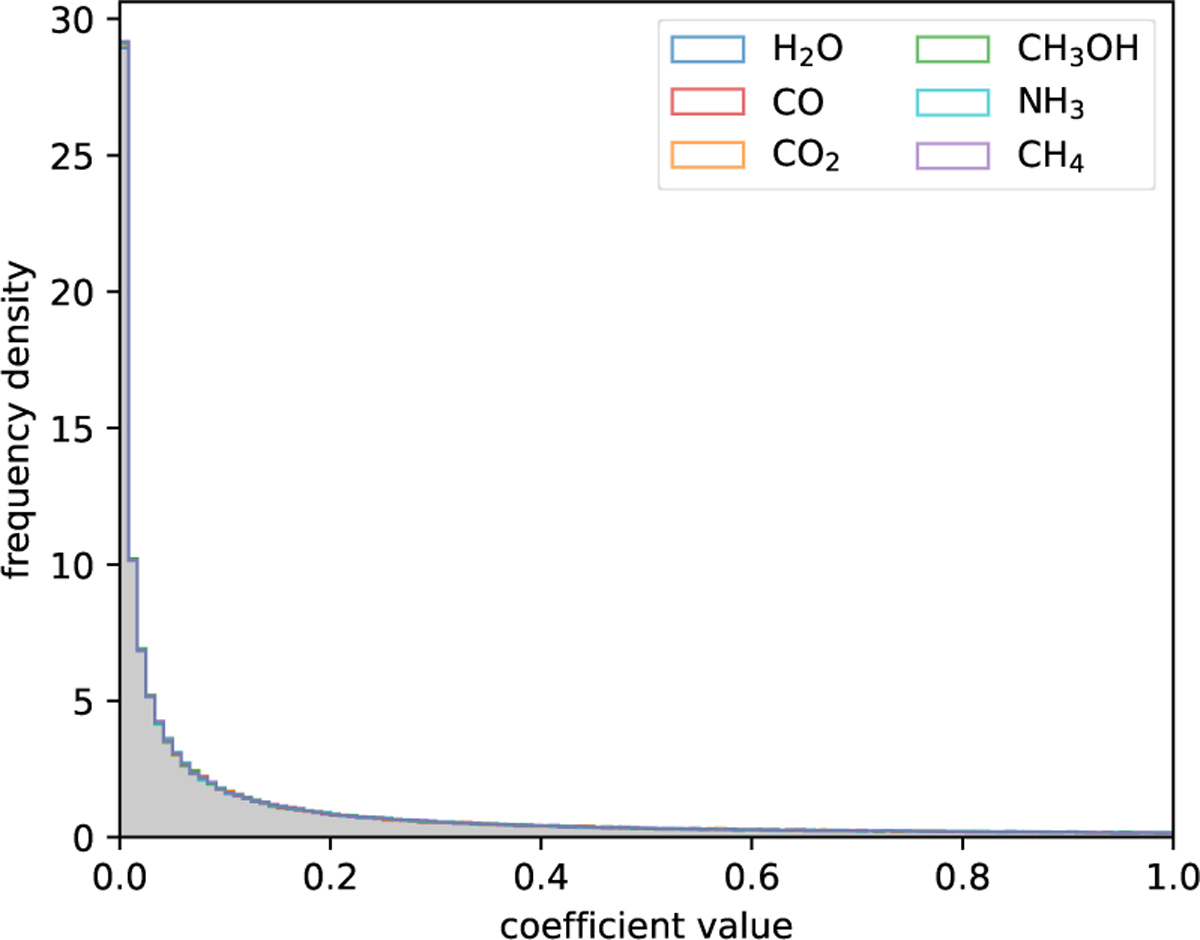
Histogram of the generated coefficients using the algorithm mentioned in the text, with 240 000 combinations. In colours we can see the histogram of the population of coefficients for each molecule (they are very similar, and hence difficult to distinguish), while in grey we see the histogram of the values of all the coefficients.
Current usage metrics show cumulative count of Article Views (full-text article views including HTML views, PDF and ePub downloads, according to the available data) and Abstracts Views on Vision4Press platform.
Data correspond to usage on the plateform after 2015. The current usage metrics is available 48-96 hours after online publication and is updated daily on week days.
Initial download of the metrics may take a while.