Fig. G.2
Download original image
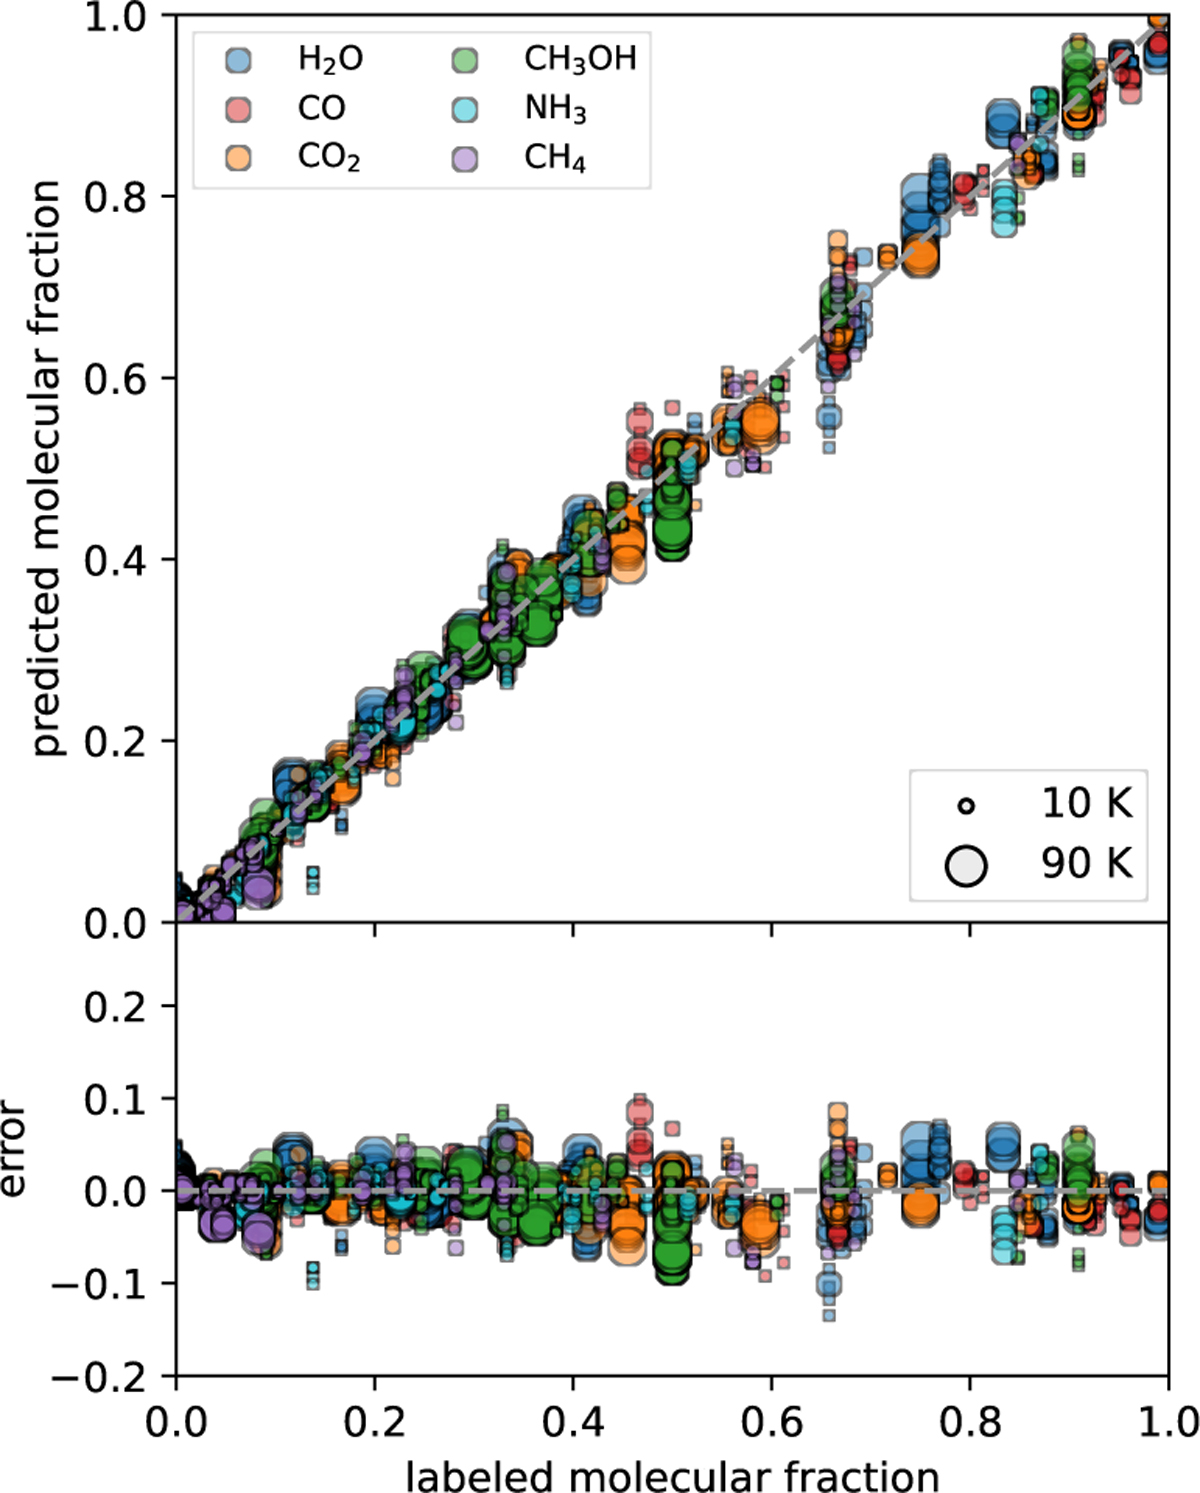
Result of the validation for our neural networks after the training with simulated saturation, for the first random split of the dataset. The copies of the spectra with simulated saturation are included here, this is why there are many clusters of points with the same colour and value of labeled molecular fraction. This is equivalent to Fig. 5.
Current usage metrics show cumulative count of Article Views (full-text article views including HTML views, PDF and ePub downloads, according to the available data) and Abstracts Views on Vision4Press platform.
Data correspond to usage on the plateform after 2015. The current usage metrics is available 48-96 hours after online publication and is updated daily on week days.
Initial download of the metrics may take a while.