Fig. 3
Download original image
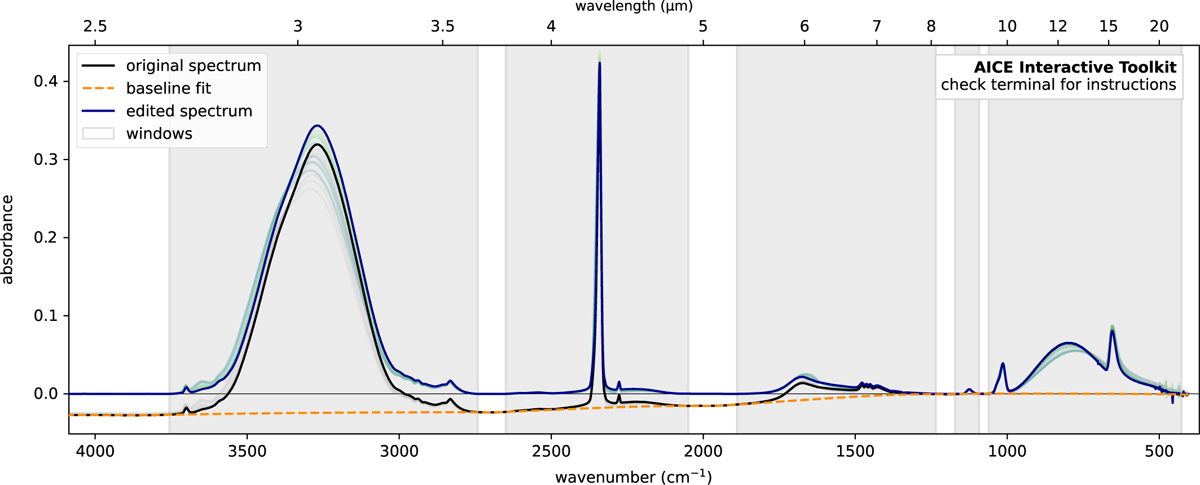
Example of the baseline reduction for experiment #35 from LIDA, performed with the interactive Python interface developed by us and included within AICE. The plot shows the spectra corresponding to this experiment H2O: CO2: CH3OH, 9:2:1), for several temperatures. In black and blue, we display the original and reduced spectrum from the experiment at 10 K. In light grey and light green+yellow, we indicate the spectra for the rest of temperatures measured in the experiment up to 96 K. We manually selected the windows that define the points of the continuum subtraction (white regions) and the tool performed a baseline fit based on splines.
Current usage metrics show cumulative count of Article Views (full-text article views including HTML views, PDF and ePub downloads, according to the available data) and Abstracts Views on Vision4Press platform.
Data correspond to usage on the plateform after 2015. The current usage metrics is available 48-96 hours after online publication and is updated daily on week days.
Initial download of the metrics may take a while.