Fig. 4
Download original image
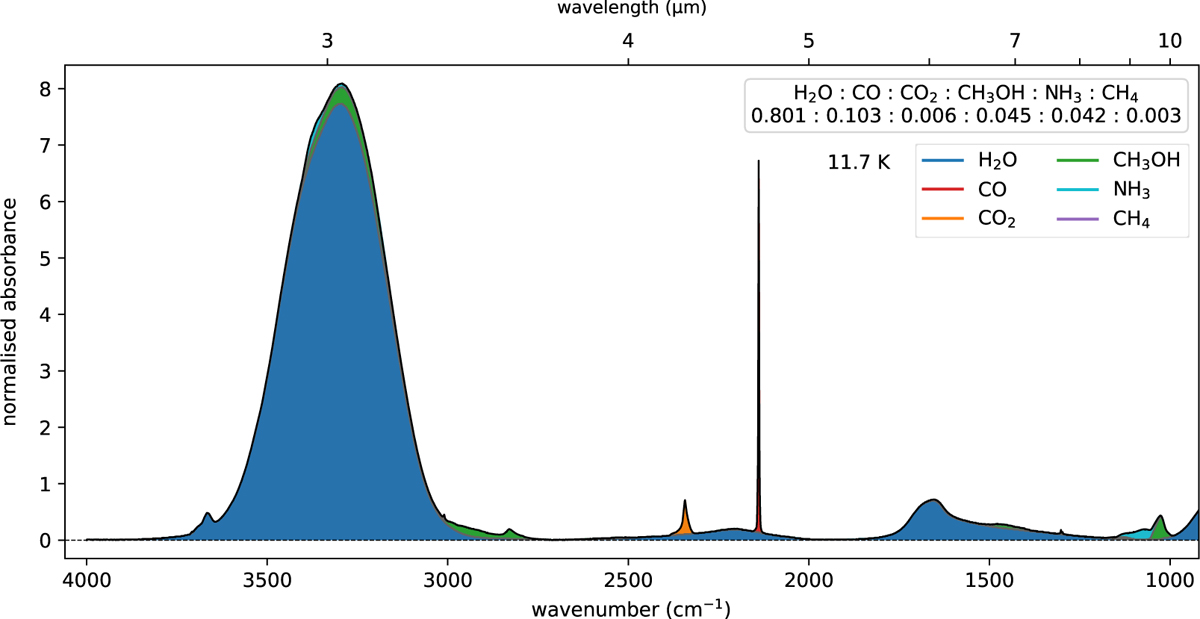
Example of synthetic generated spectrum (#21), normalised by its mean absorbance value. The colours represent the different molecular contributions. This spectrum represents a layered mixture of H2O, CO, CH3OH, NH3, CO2, and CH4, in decreasing order molecular fraction, all of them at a temperature of 11.7 K. The pure ice spectra used to construct this curve come from different experiments from LIDA, OCdb and Univap (see Table D.1), at different temperatures close to 11.7 K (see Section 2.3.4 for more details).
Current usage metrics show cumulative count of Article Views (full-text article views including HTML views, PDF and ePub downloads, according to the available data) and Abstracts Views on Vision4Press platform.
Data correspond to usage on the plateform after 2015. The current usage metrics is available 48-96 hours after online publication and is updated daily on week days.
Initial download of the metrics may take a while.