Fig. 5
Download original image
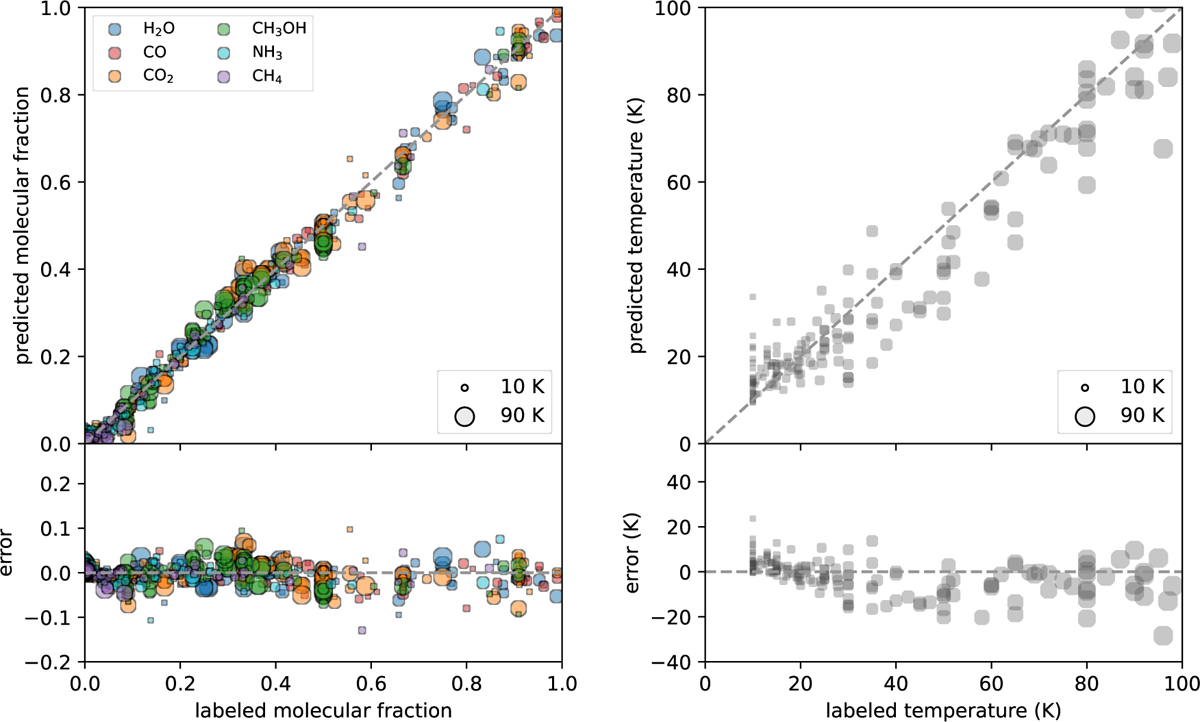
Performance of our neural networks after the training with the first training+validation split, with respect to the spectra included in the validation subset. The plots show the predicted versus true labeled values for the molecular fractions and temperature. Left panels: molecular fractions of ice spectra. Each ice spectrum in the validation subset (with a certain composition and temperature) corresponds to six circles in the plot: one for each targeted molecule (denoted by colours). The sizes of the circles indicate the temperature of the ice. The bottom panel reports the difference between the predicted molecular fraction and the labeled value from the experiment. Right panels: temperature of ice spectra, represented by each circle. Again, the bottom panel reports the difference between the predicted and the labeled values.
Current usage metrics show cumulative count of Article Views (full-text article views including HTML views, PDF and ePub downloads, according to the available data) and Abstracts Views on Vision4Press platform.
Data correspond to usage on the plateform after 2015. The current usage metrics is available 48-96 hours after online publication and is updated daily on week days.
Initial download of the metrics may take a while.