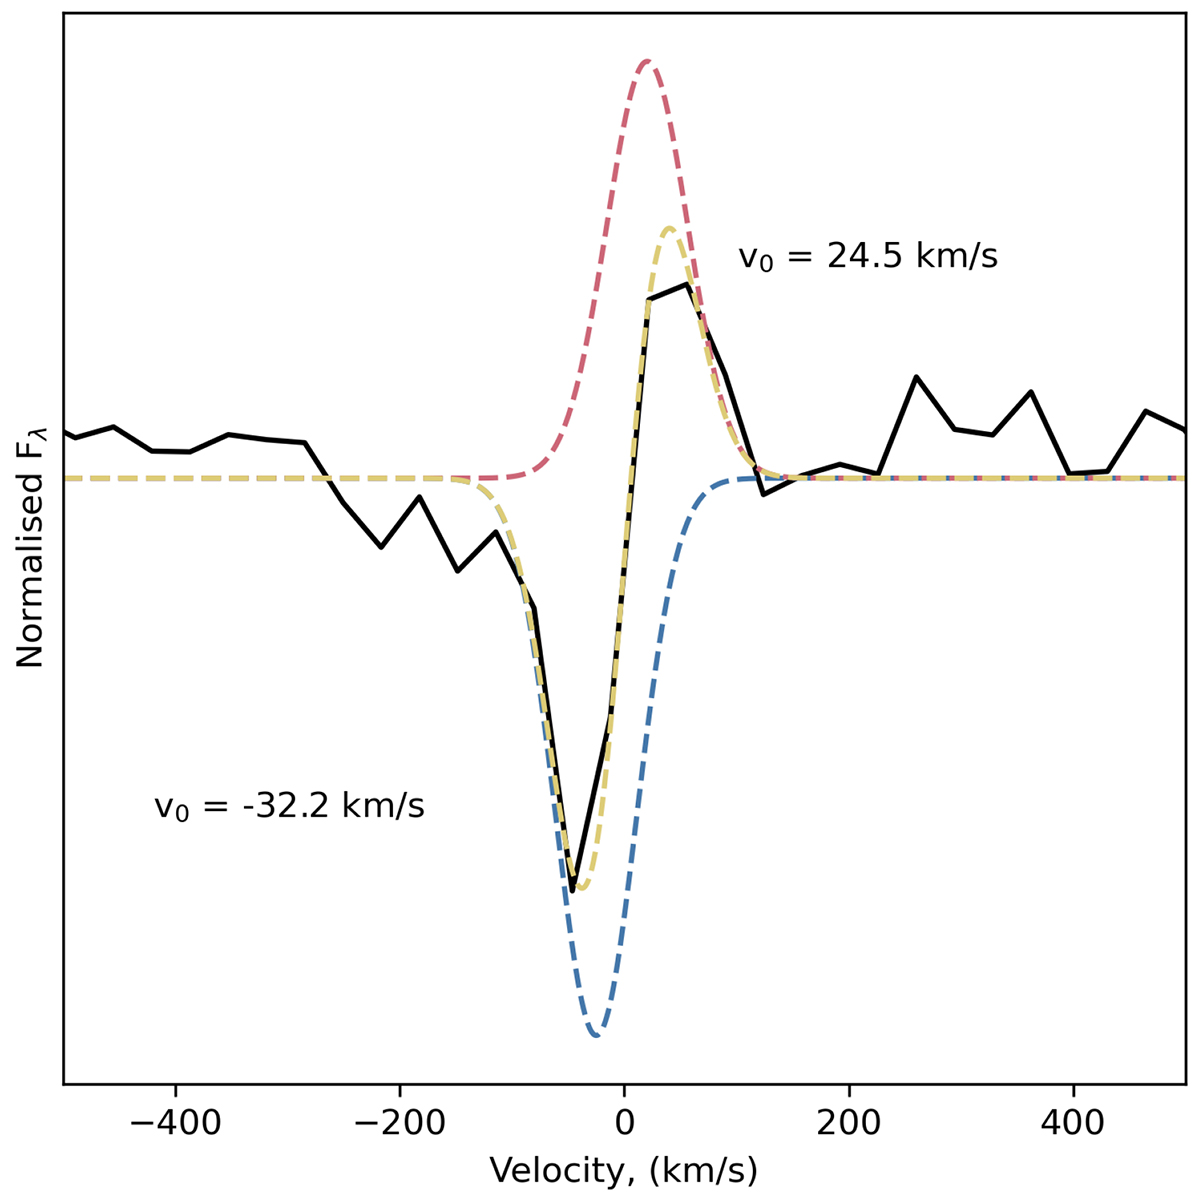
Fig. 15.
Download original image
Apparent narrow P Cygni profile in the spectrum taken at 262 d. We subtracted the overlaying broad emission feature and fit two Gaussian profiles with FWHMs fixed to the instrumental resolution of 85 km s−1 to the residual spectrum. The red and blue dotted lines show the best-fit emission and absorption features, respectively, while the yellow dotted line shows the sum of the two features. The peak-to-peak separation of the two profiles is 56.7 km/s.
Current usage metrics show cumulative count of Article Views (full-text article views including HTML views, PDF and ePub downloads, according to the available data) and Abstracts Views on Vision4Press platform.
Data correspond to usage on the plateform after 2015. The current usage metrics is available 48-96 hours after online publication and is updated daily on week days.
Initial download of the metrics may take a while.