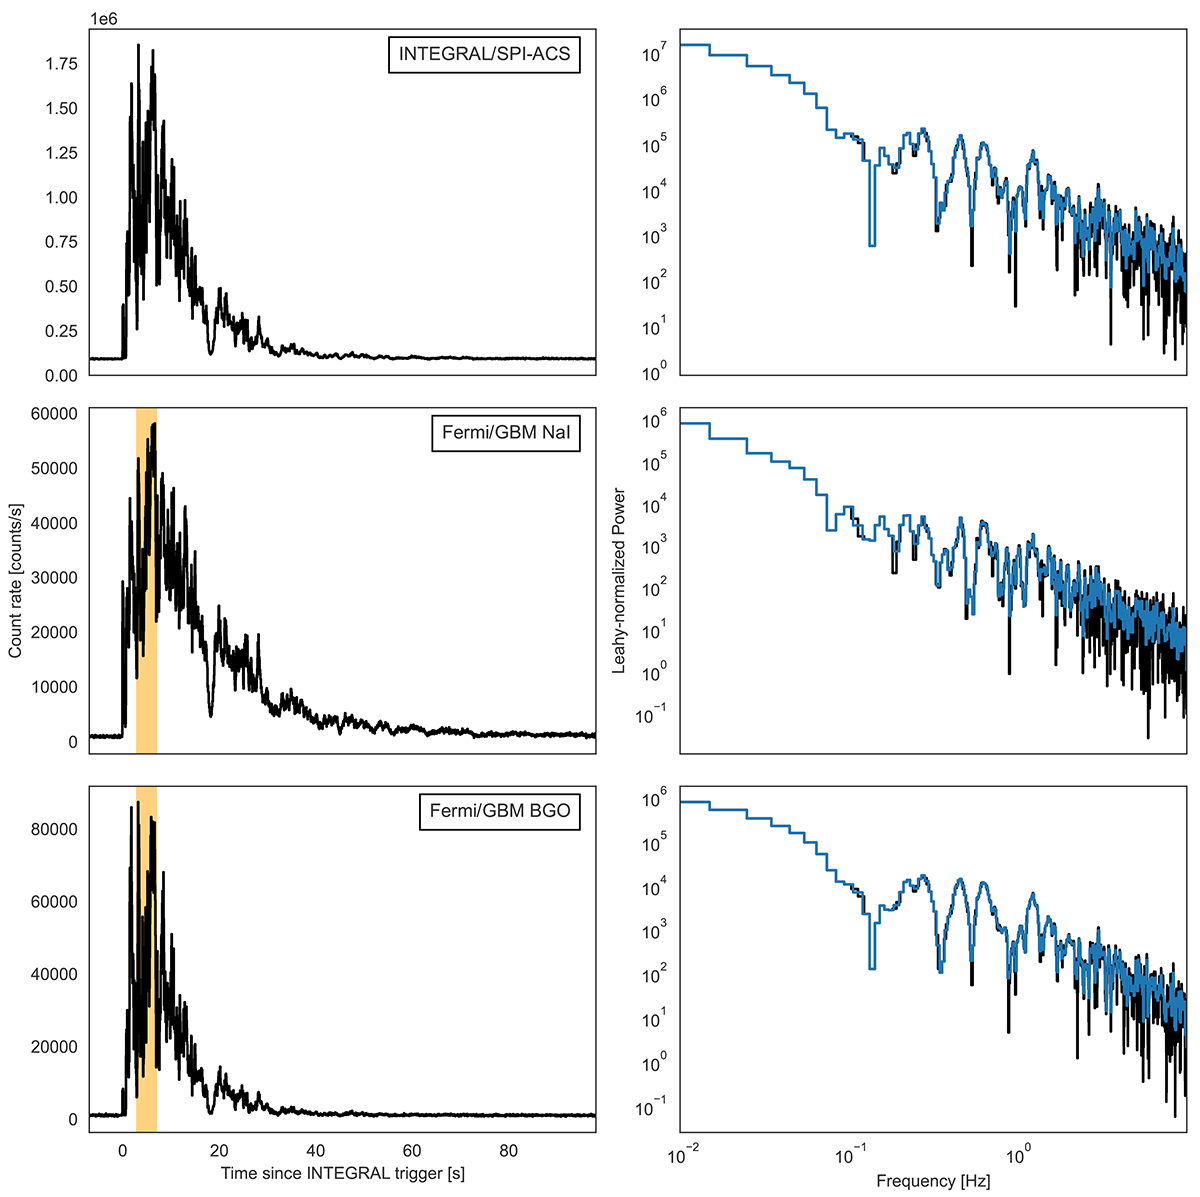
Fig. 1.
Download original image
Top: Light curves of GRB 230307A in 50 ms temporal resolution as seen with SPI-ACS (left panel), and the brightest GBM NaI and BGO detectors; NaI 10 (middle panel) and BGO 1 (right panel). The time is in seconds since the trigger time. The orange area within the lower plots marks the time interval of 2.5 to 7.5 s, for which the GBM team issued a warning for possible data problems. Bottom: Fourier periodograms corresponding to the GRB light curves on the top. We show both the unbinned periodogram (black) and the log-binned periodogram (blue). Note that for the Fermi/GBM data, these do include the segment for which a warning was issued. All three periodograms contain strong variability above the instrumental noise limit at all frequencies considered here, and show peaks on top of the broadband variability present across all frequencies in the periodogram.
Current usage metrics show cumulative count of Article Views (full-text article views including HTML views, PDF and ePub downloads, according to the available data) and Abstracts Views on Vision4Press platform.
Data correspond to usage on the plateform after 2015. The current usage metrics is available 48-96 hours after online publication and is updated daily on week days.
Initial download of the metrics may take a while.