Fig. 12.
Download original image
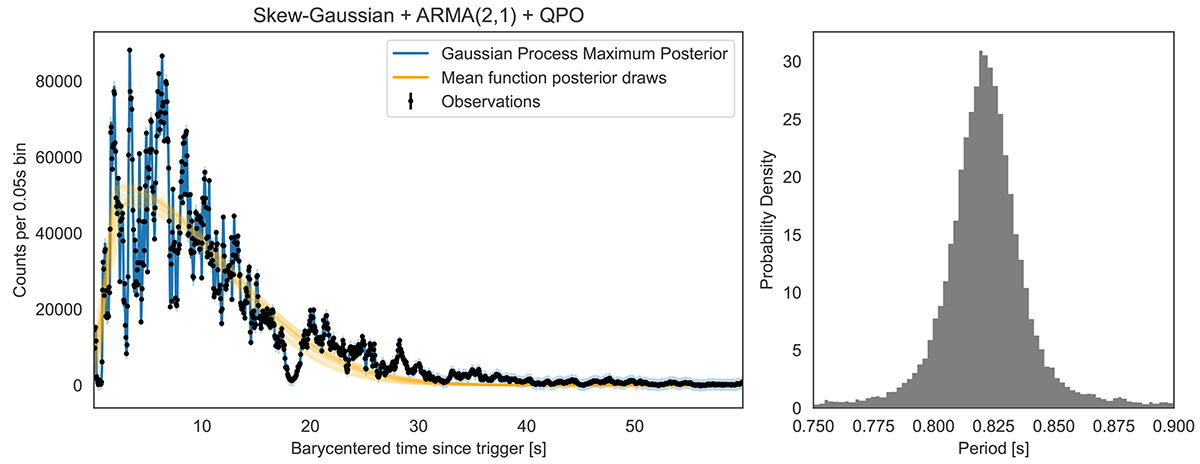
Left: INTEGRAL SPI-ACS observation (black) with the maximum a posteriori model comprising a CARMA(2,1) process, a QPO and a skew-Gaussian mean function (blue), with posterior draws from the mean function in orange. Right: Posterior probability density of the period parameter shows a clear peak at 0.82 s, consistent with results obtained using the simpler DRW model.
Current usage metrics show cumulative count of Article Views (full-text article views including HTML views, PDF and ePub downloads, according to the available data) and Abstracts Views on Vision4Press platform.
Data correspond to usage on the plateform after 2015. The current usage metrics is available 48-96 hours after online publication and is updated daily on week days.
Initial download of the metrics may take a while.