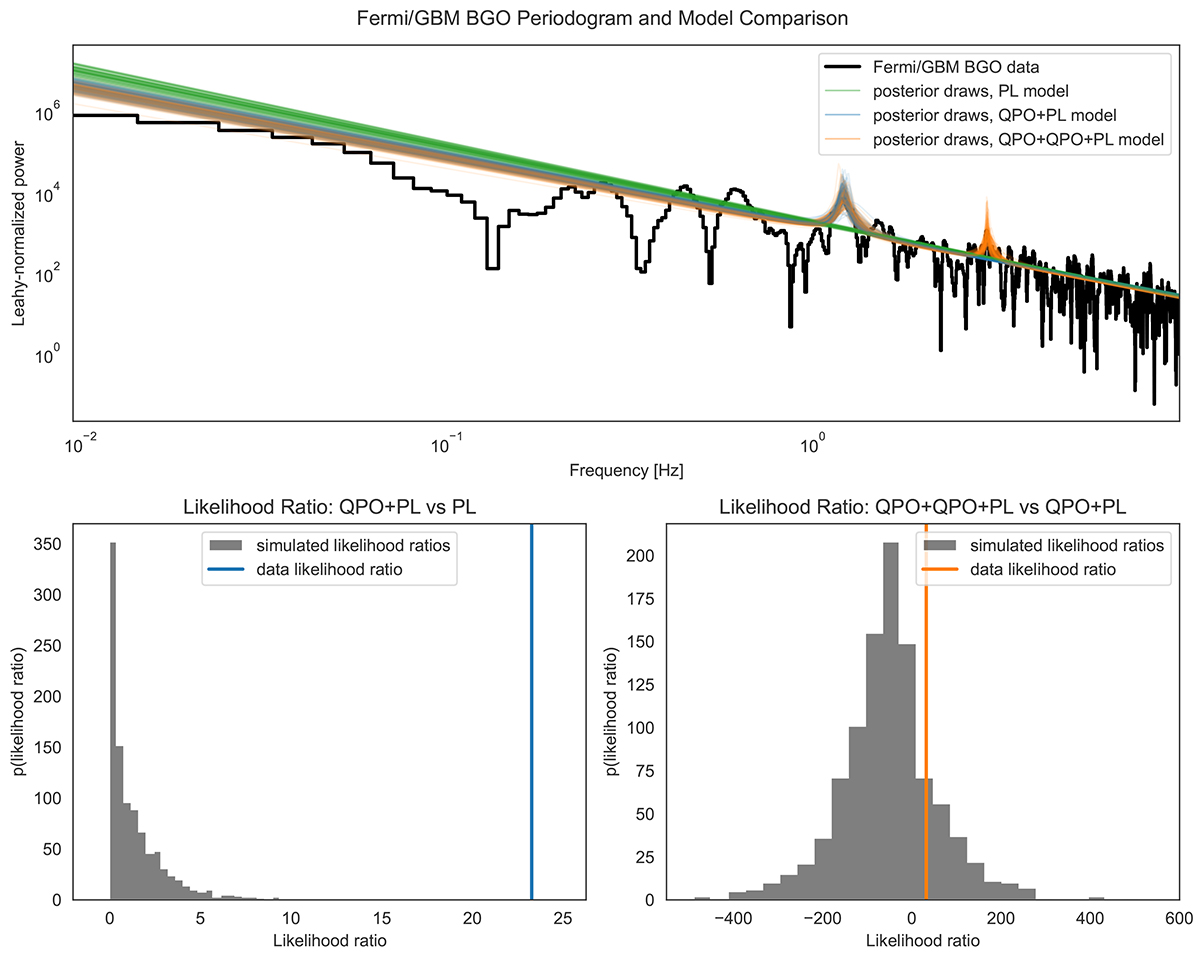
Fig. A.2.
Download original image
Left: Fourier periodogram of the Fermi/GBM BGO data with posterior draws from the three models compared via LRTs: in green, the power law model; in blue, a power law model with a Lorentzian component for a single QPO; in orange, a model comprising a power law and two Lorentzians. Middle: Distribution of the likelihood ratios from 1000 simulated periodograms. The likelihood ratio for the observed periodogram is a clear outlier. Right: Same as middle panel, but for the model with two QPOs. Again, the observed likelihood ratio is a clear outlier compared with the null hypothesis (a single QPO).
Current usage metrics show cumulative count of Article Views (full-text article views including HTML views, PDF and ePub downloads, according to the available data) and Abstracts Views on Vision4Press platform.
Data correspond to usage on the plateform after 2015. The current usage metrics is available 48-96 hours after online publication and is updated daily on week days.
Initial download of the metrics may take a while.